© CIFOR-ICRAF Dashboards by SPACIAL
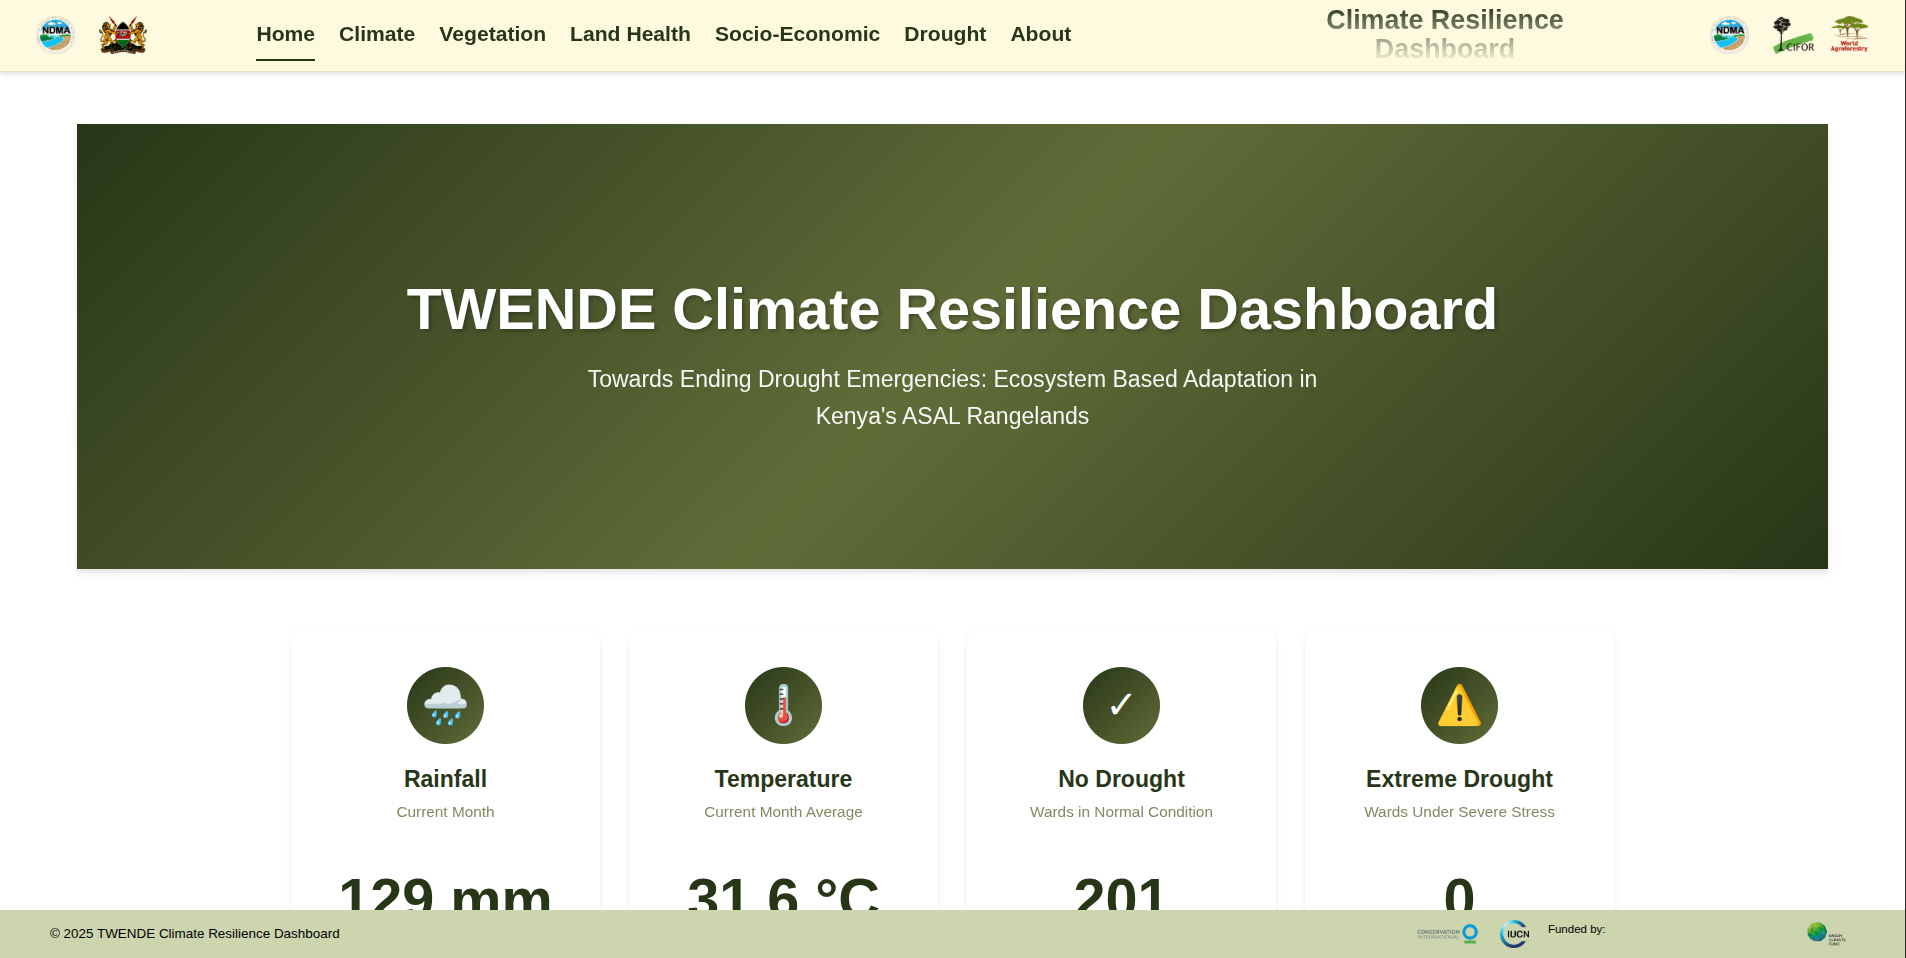
This dashboard provides near real-time monitoring of drought conditions, rainfall patterns, and temperature trends to support decision-making and enhance community resilience against climate variability.
Launch dashboard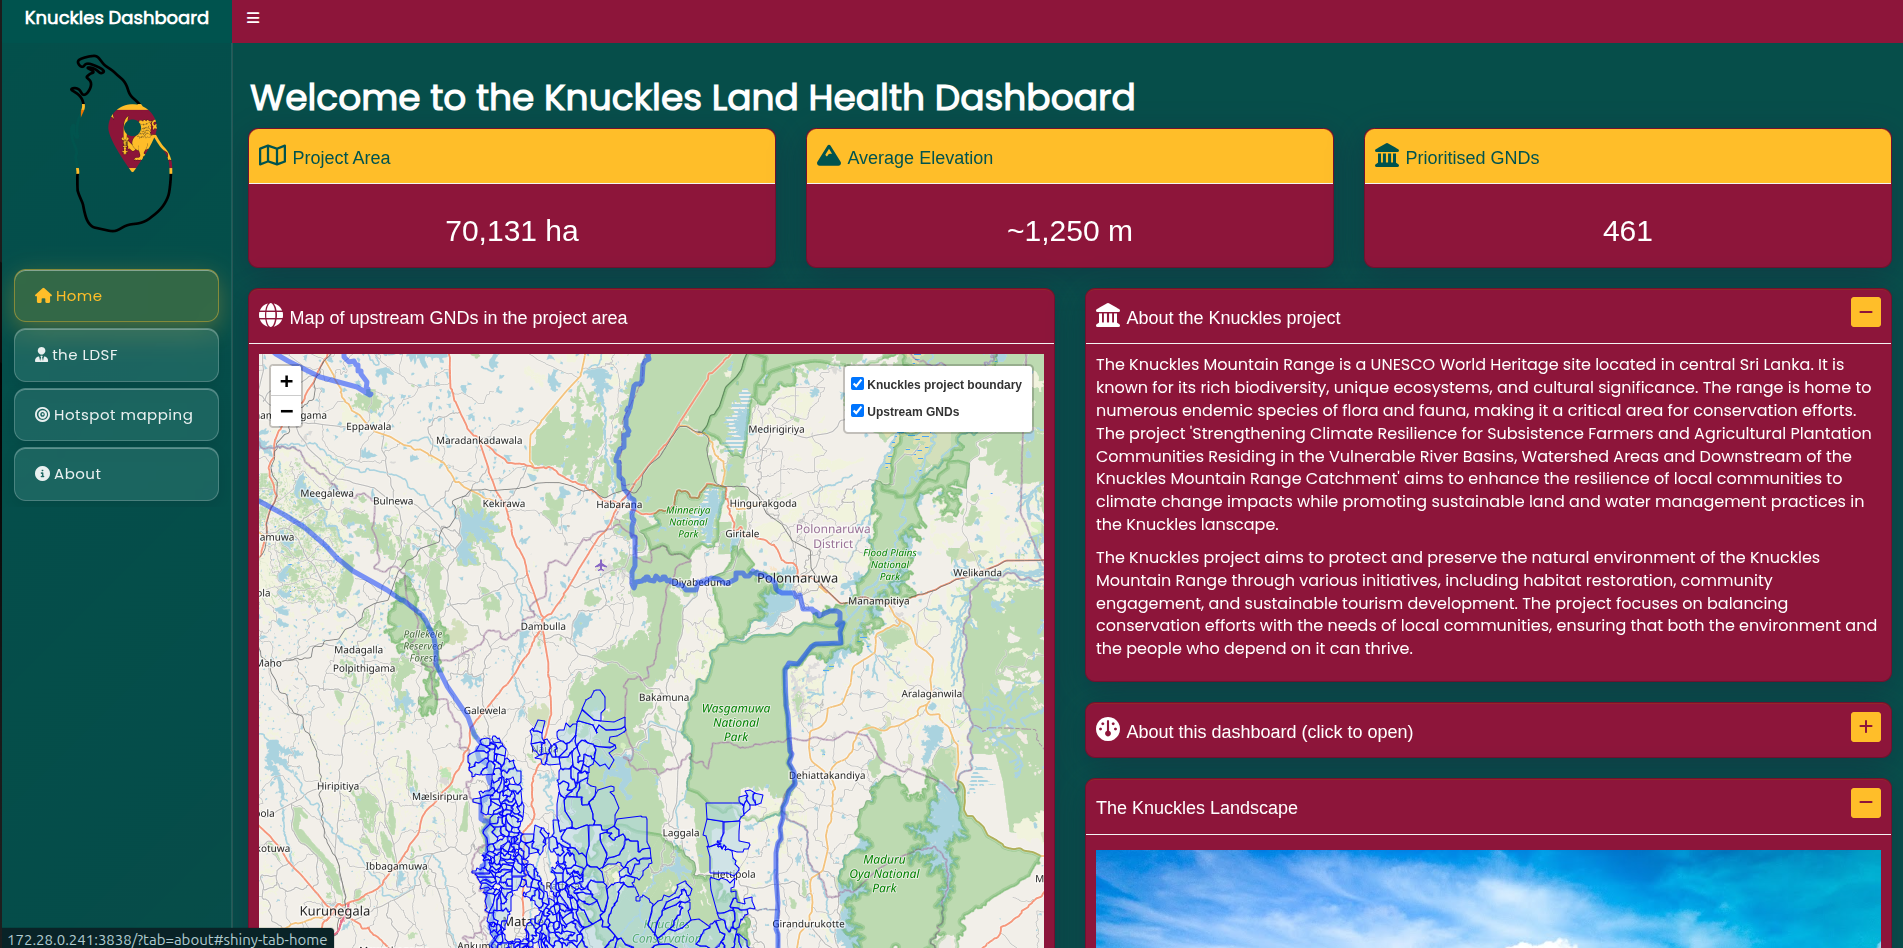
The Knuckles Dashboard is a comprehensive web-based platform for climate resilience and sustainable land management in Sri Lanka's Knuckles Mountain Range. It integrates environmental data to support conservation and community development decision-making.
Launch dashboard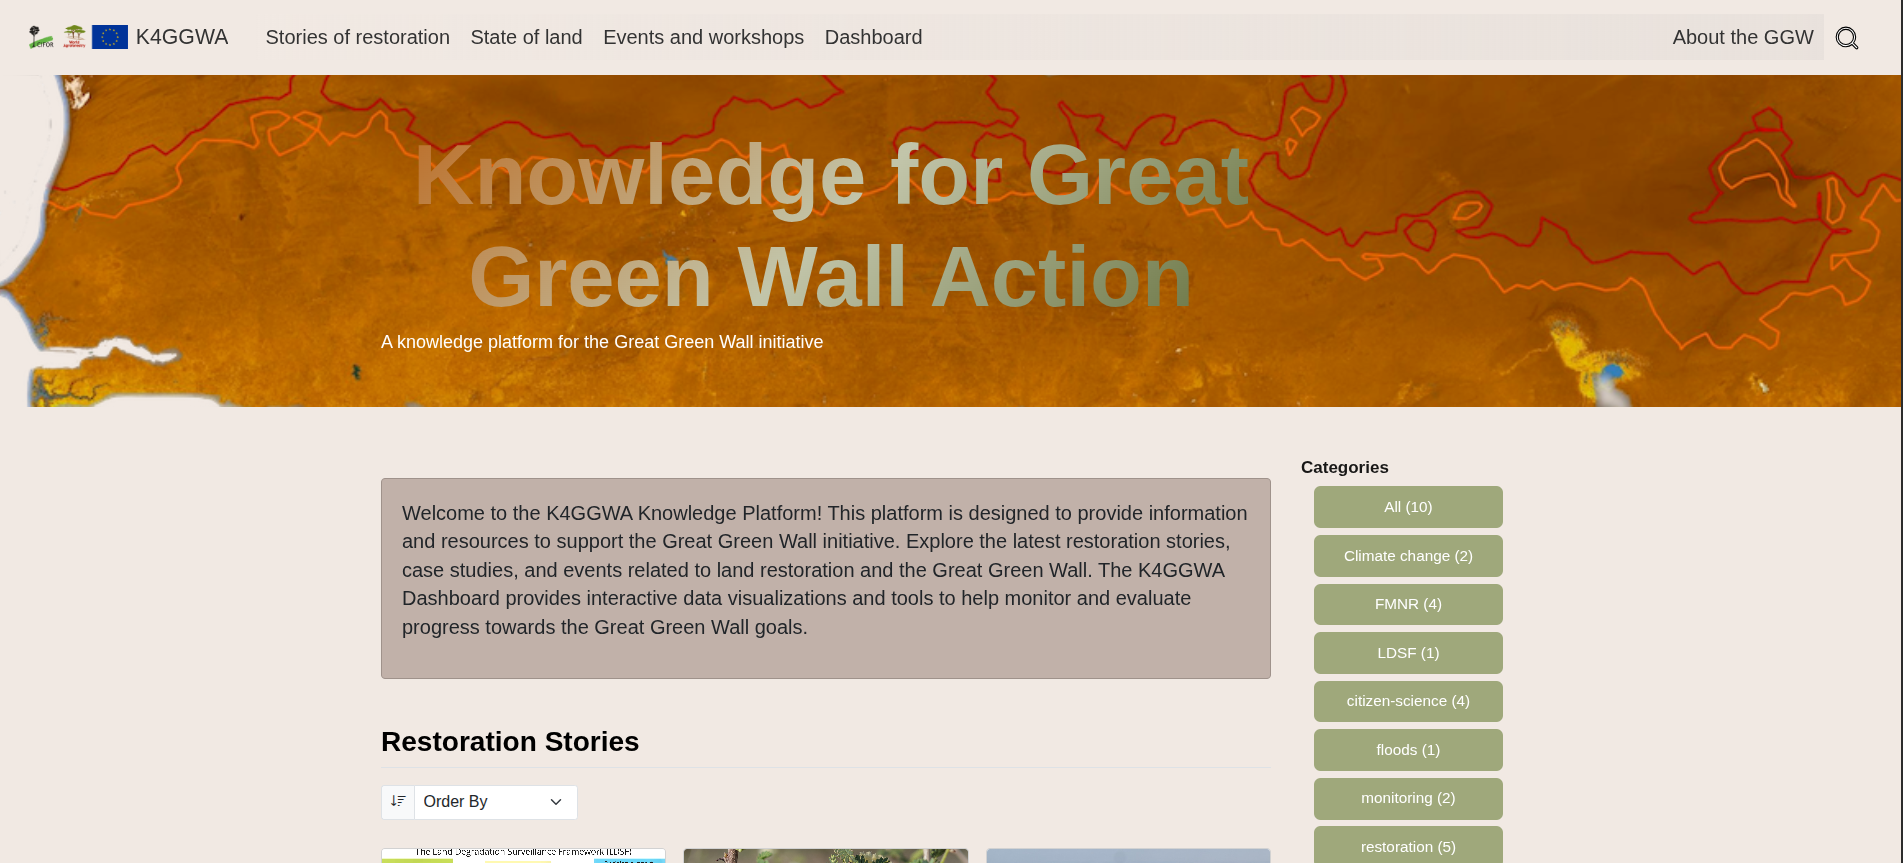
The K4GGWA Dashboard provides interactive data visualizations and tools to help monitor and evaluate progress towards the Great Green Wall goals.
Launch dashboard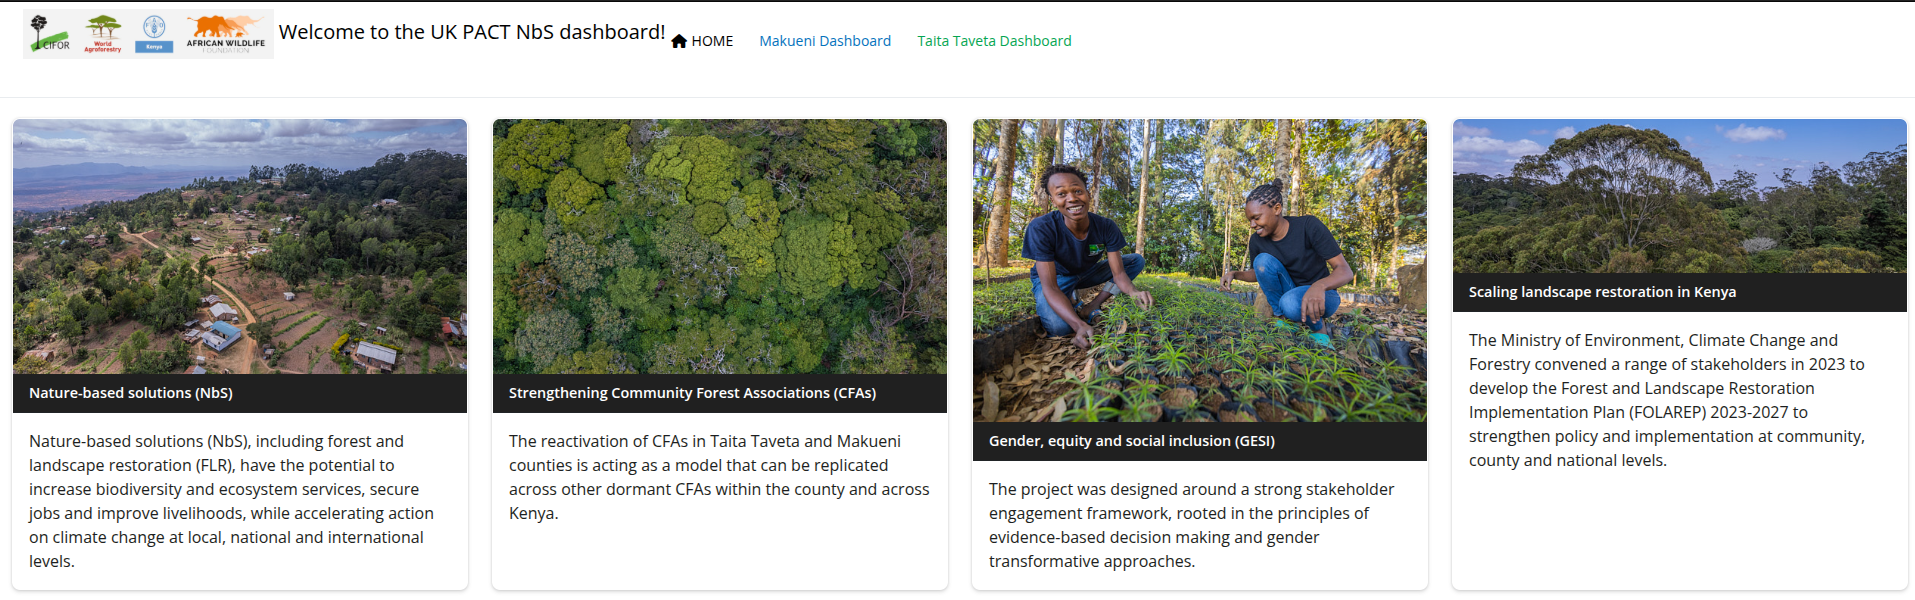
Bringing the science of monitoring land restoration to the fields of farmers
Launch dashboard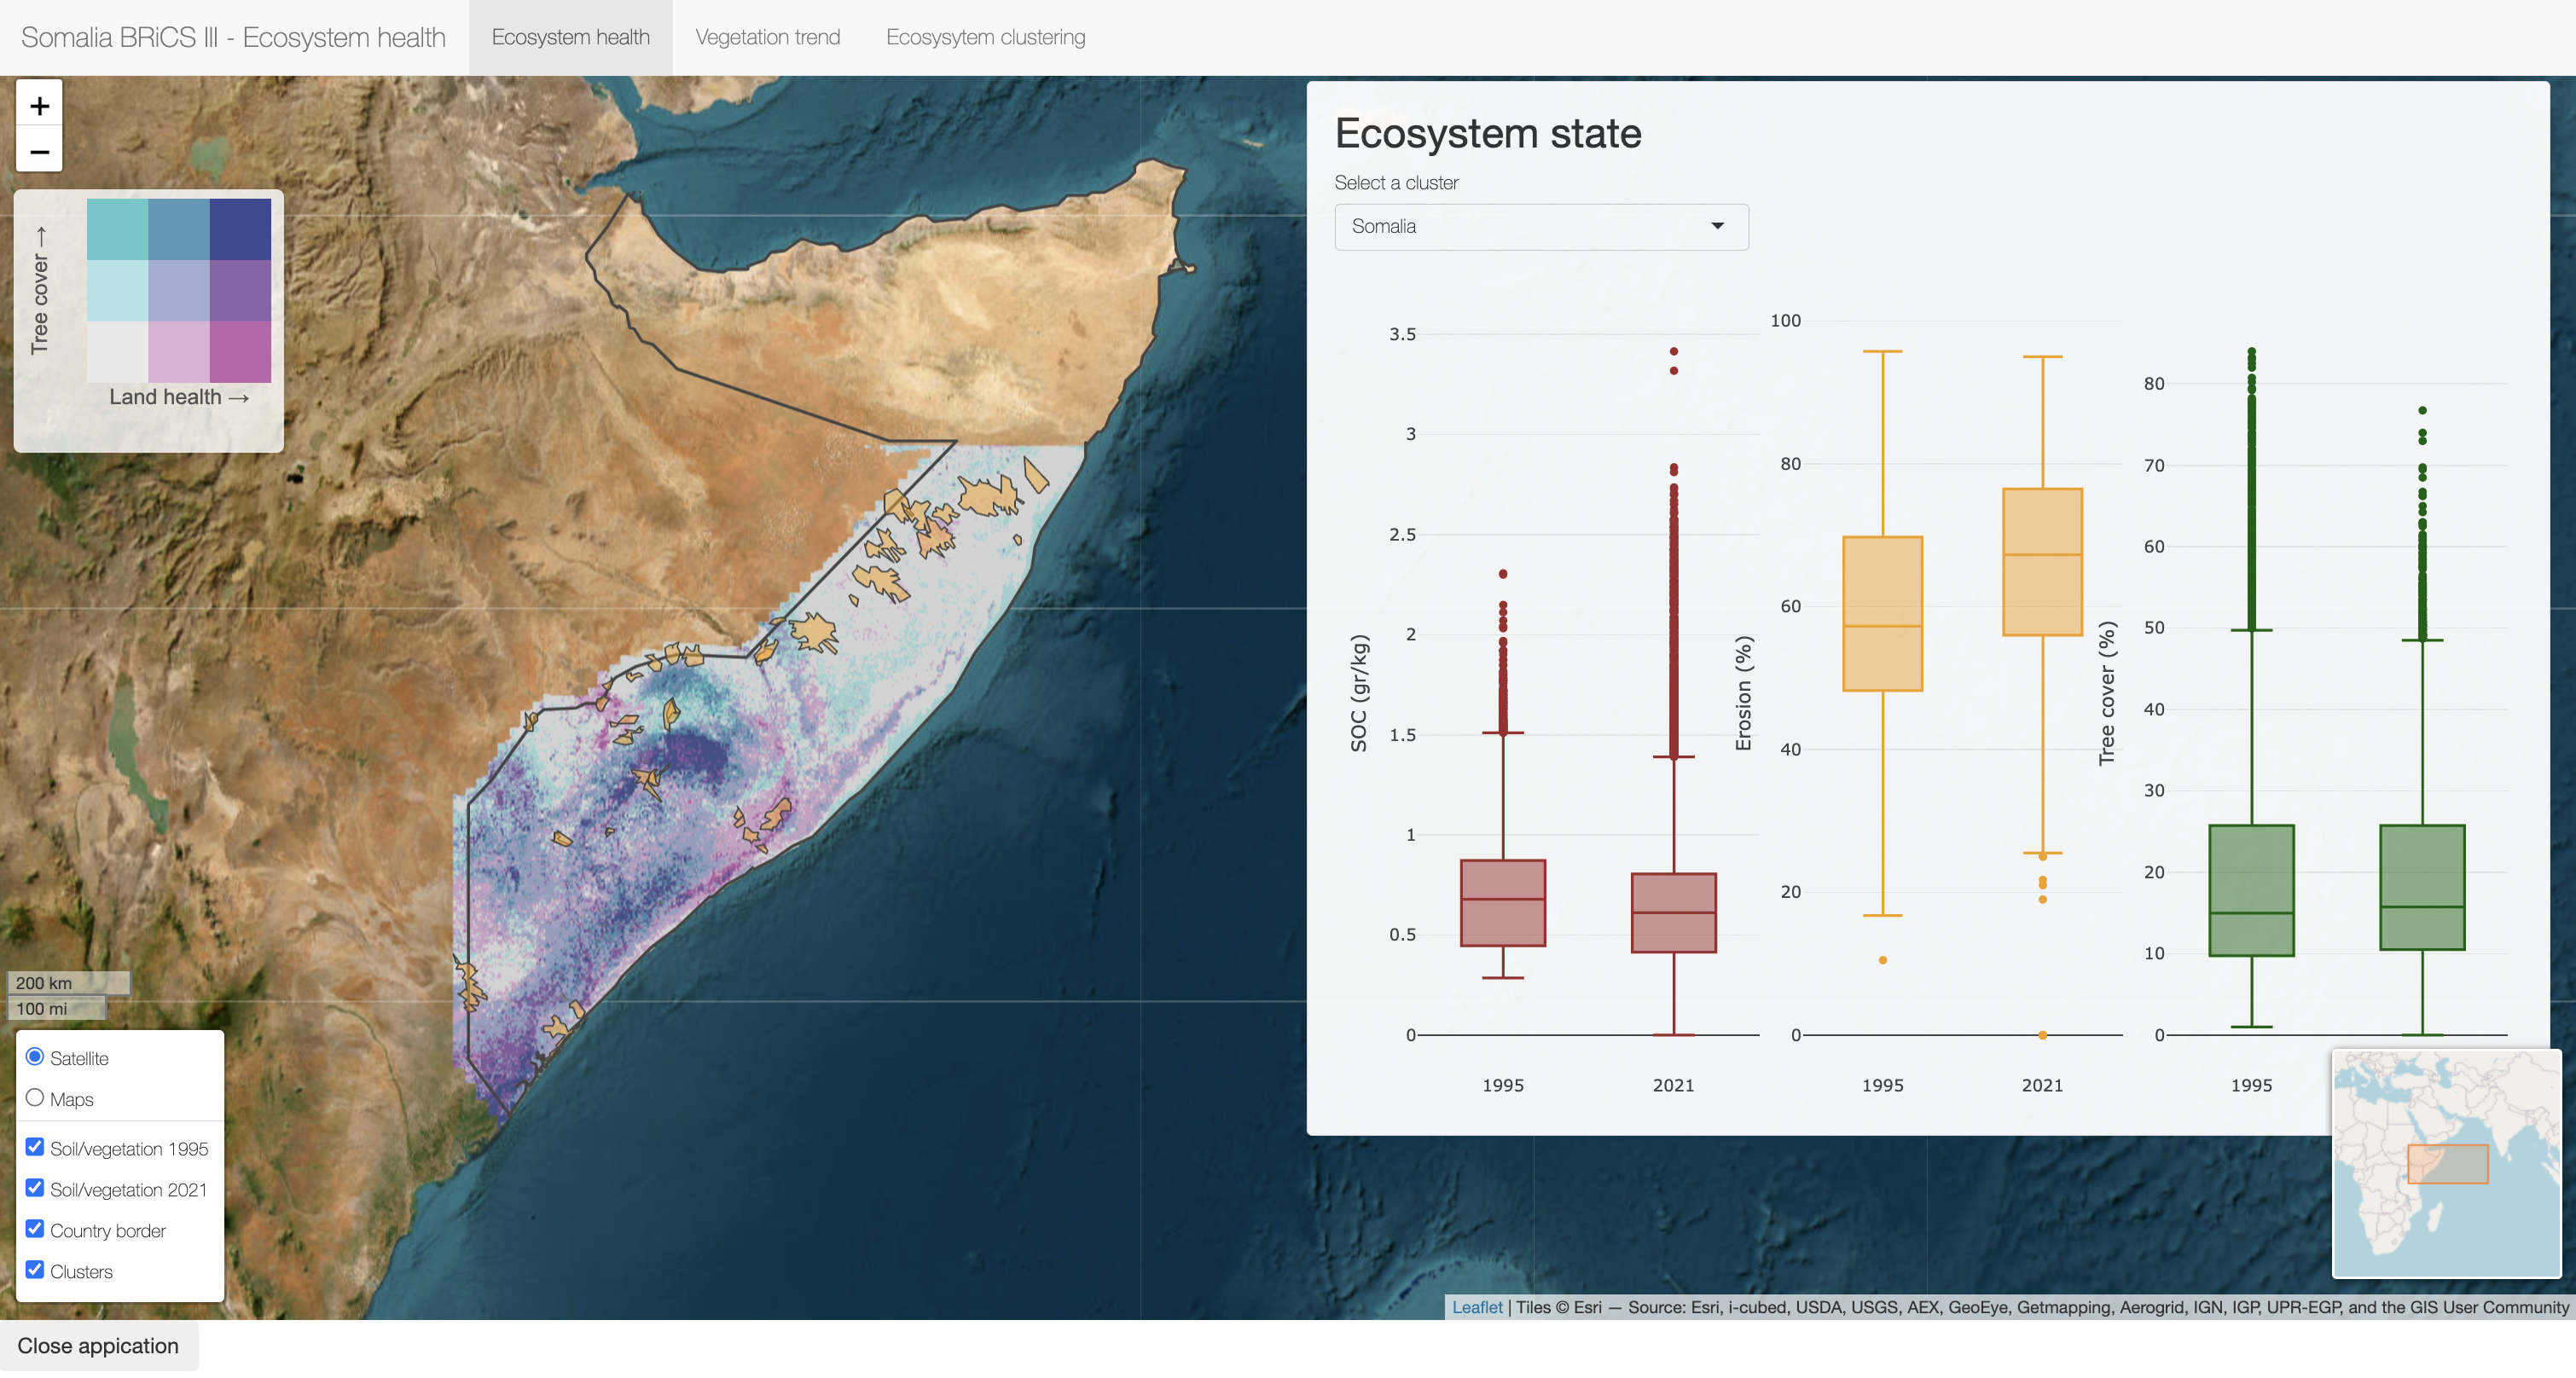
Interactive dashboard showing the land health for the BRCiS III project areas in Somalia. It contains an integrated assessment of land and vegetation health across the country, as well as vegetation trends.
Launch dashboard
Data and evidence to strengthen baseline assessments, inform interventions and monitor impacts across landscapes
Launch dashboard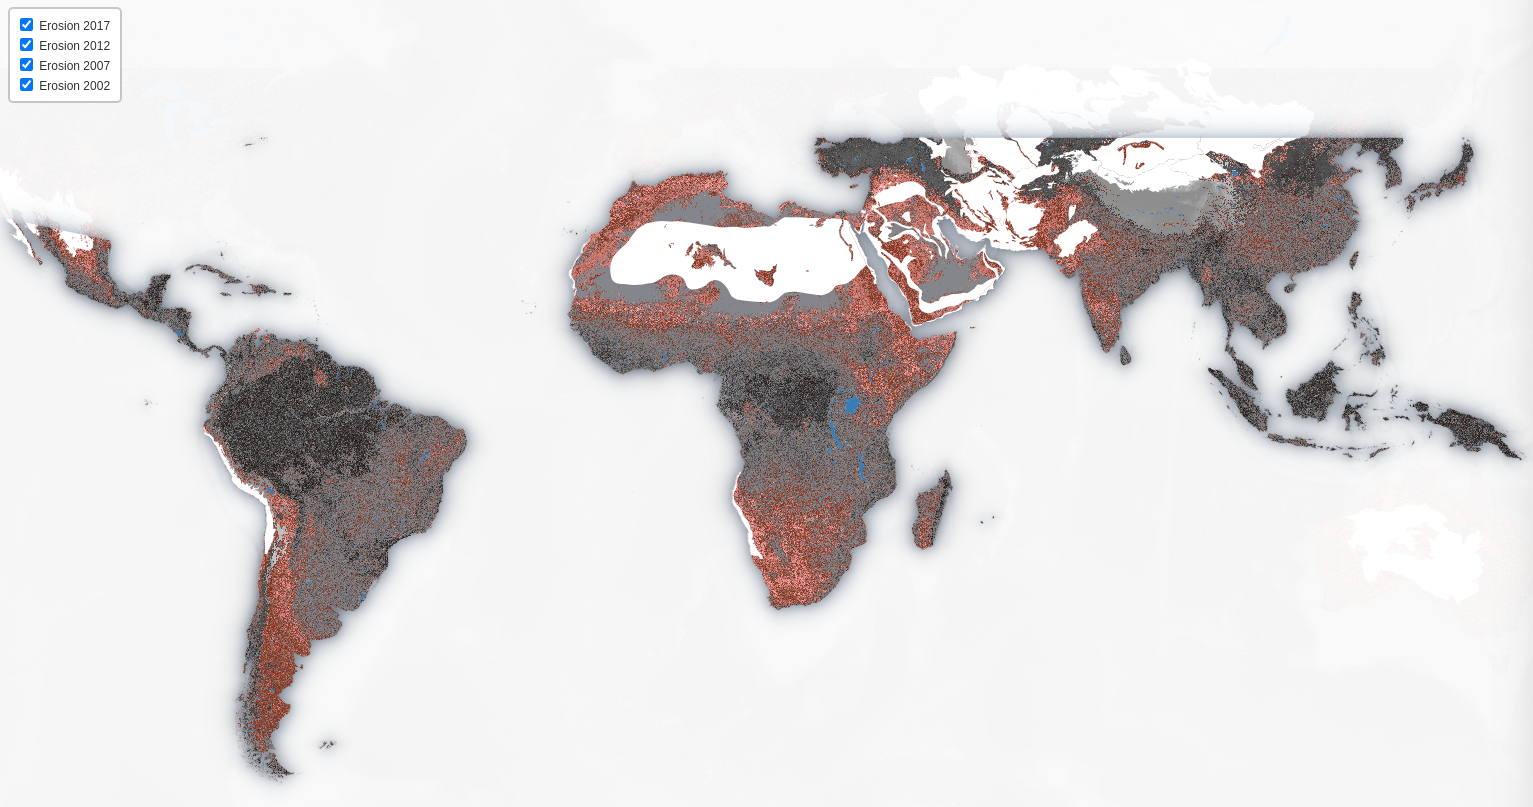
This online app was developed to allow you to interactively explore the maps produced as part of the paper 'Predicting the Spatial Distribution and Severity of Soil Erosion in the Global'
Launch dashboard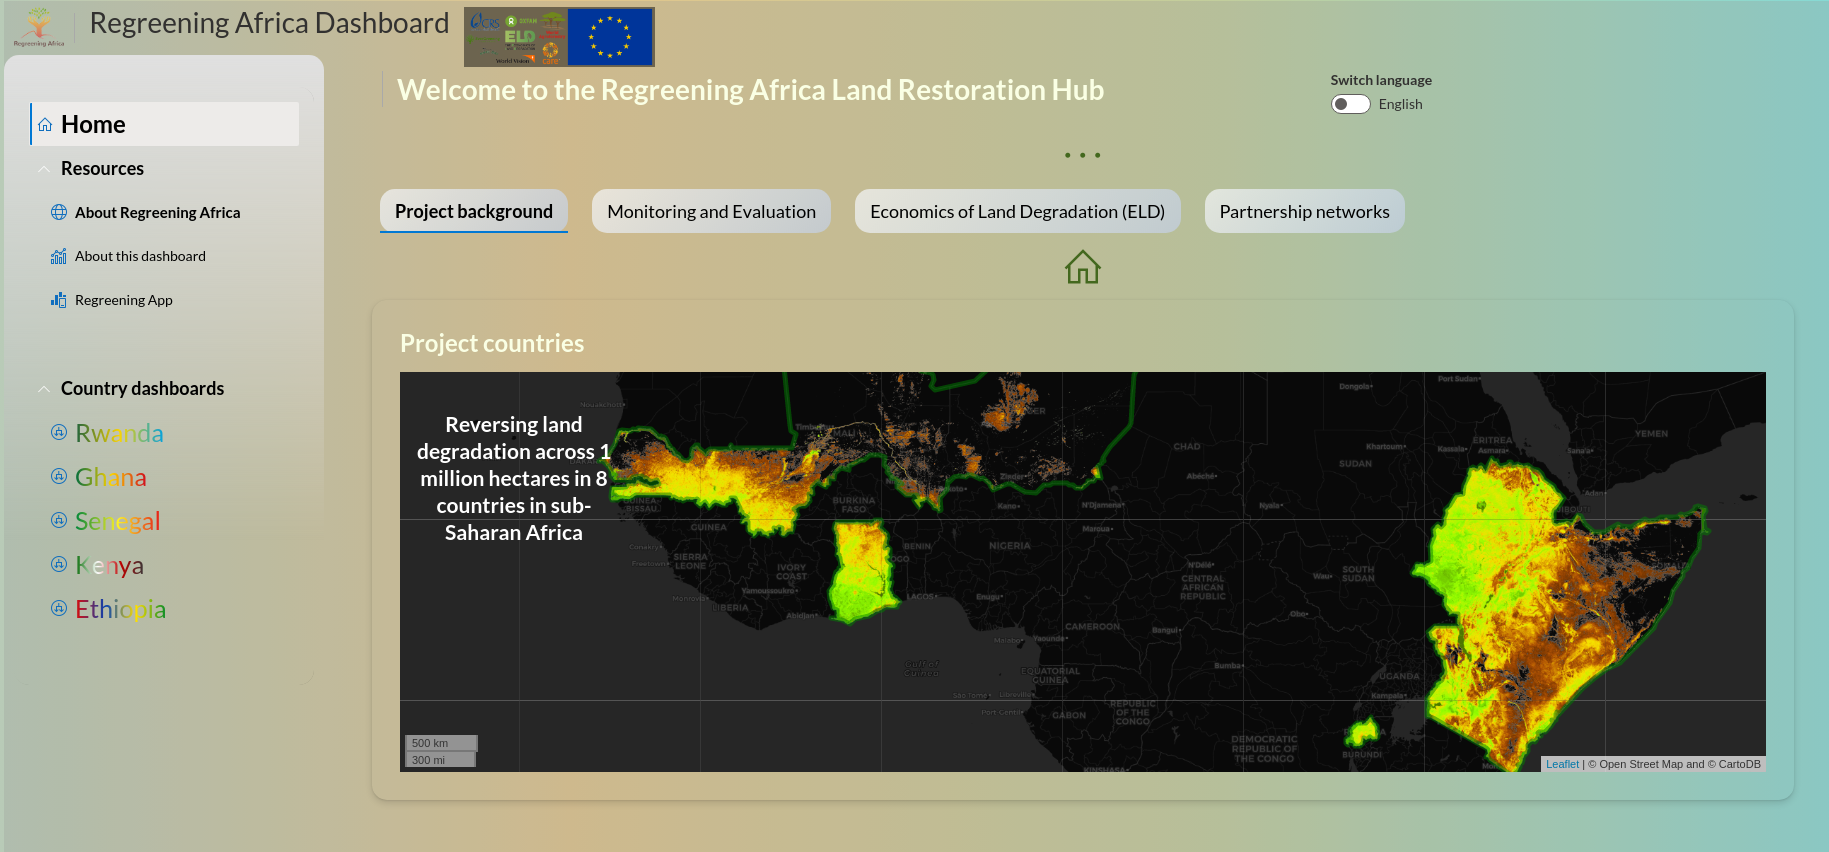
Regreening Africa aims to reverse land degradation on 1 million hectares across 8 countries in sub-Saharan Africa.
Launch dashboard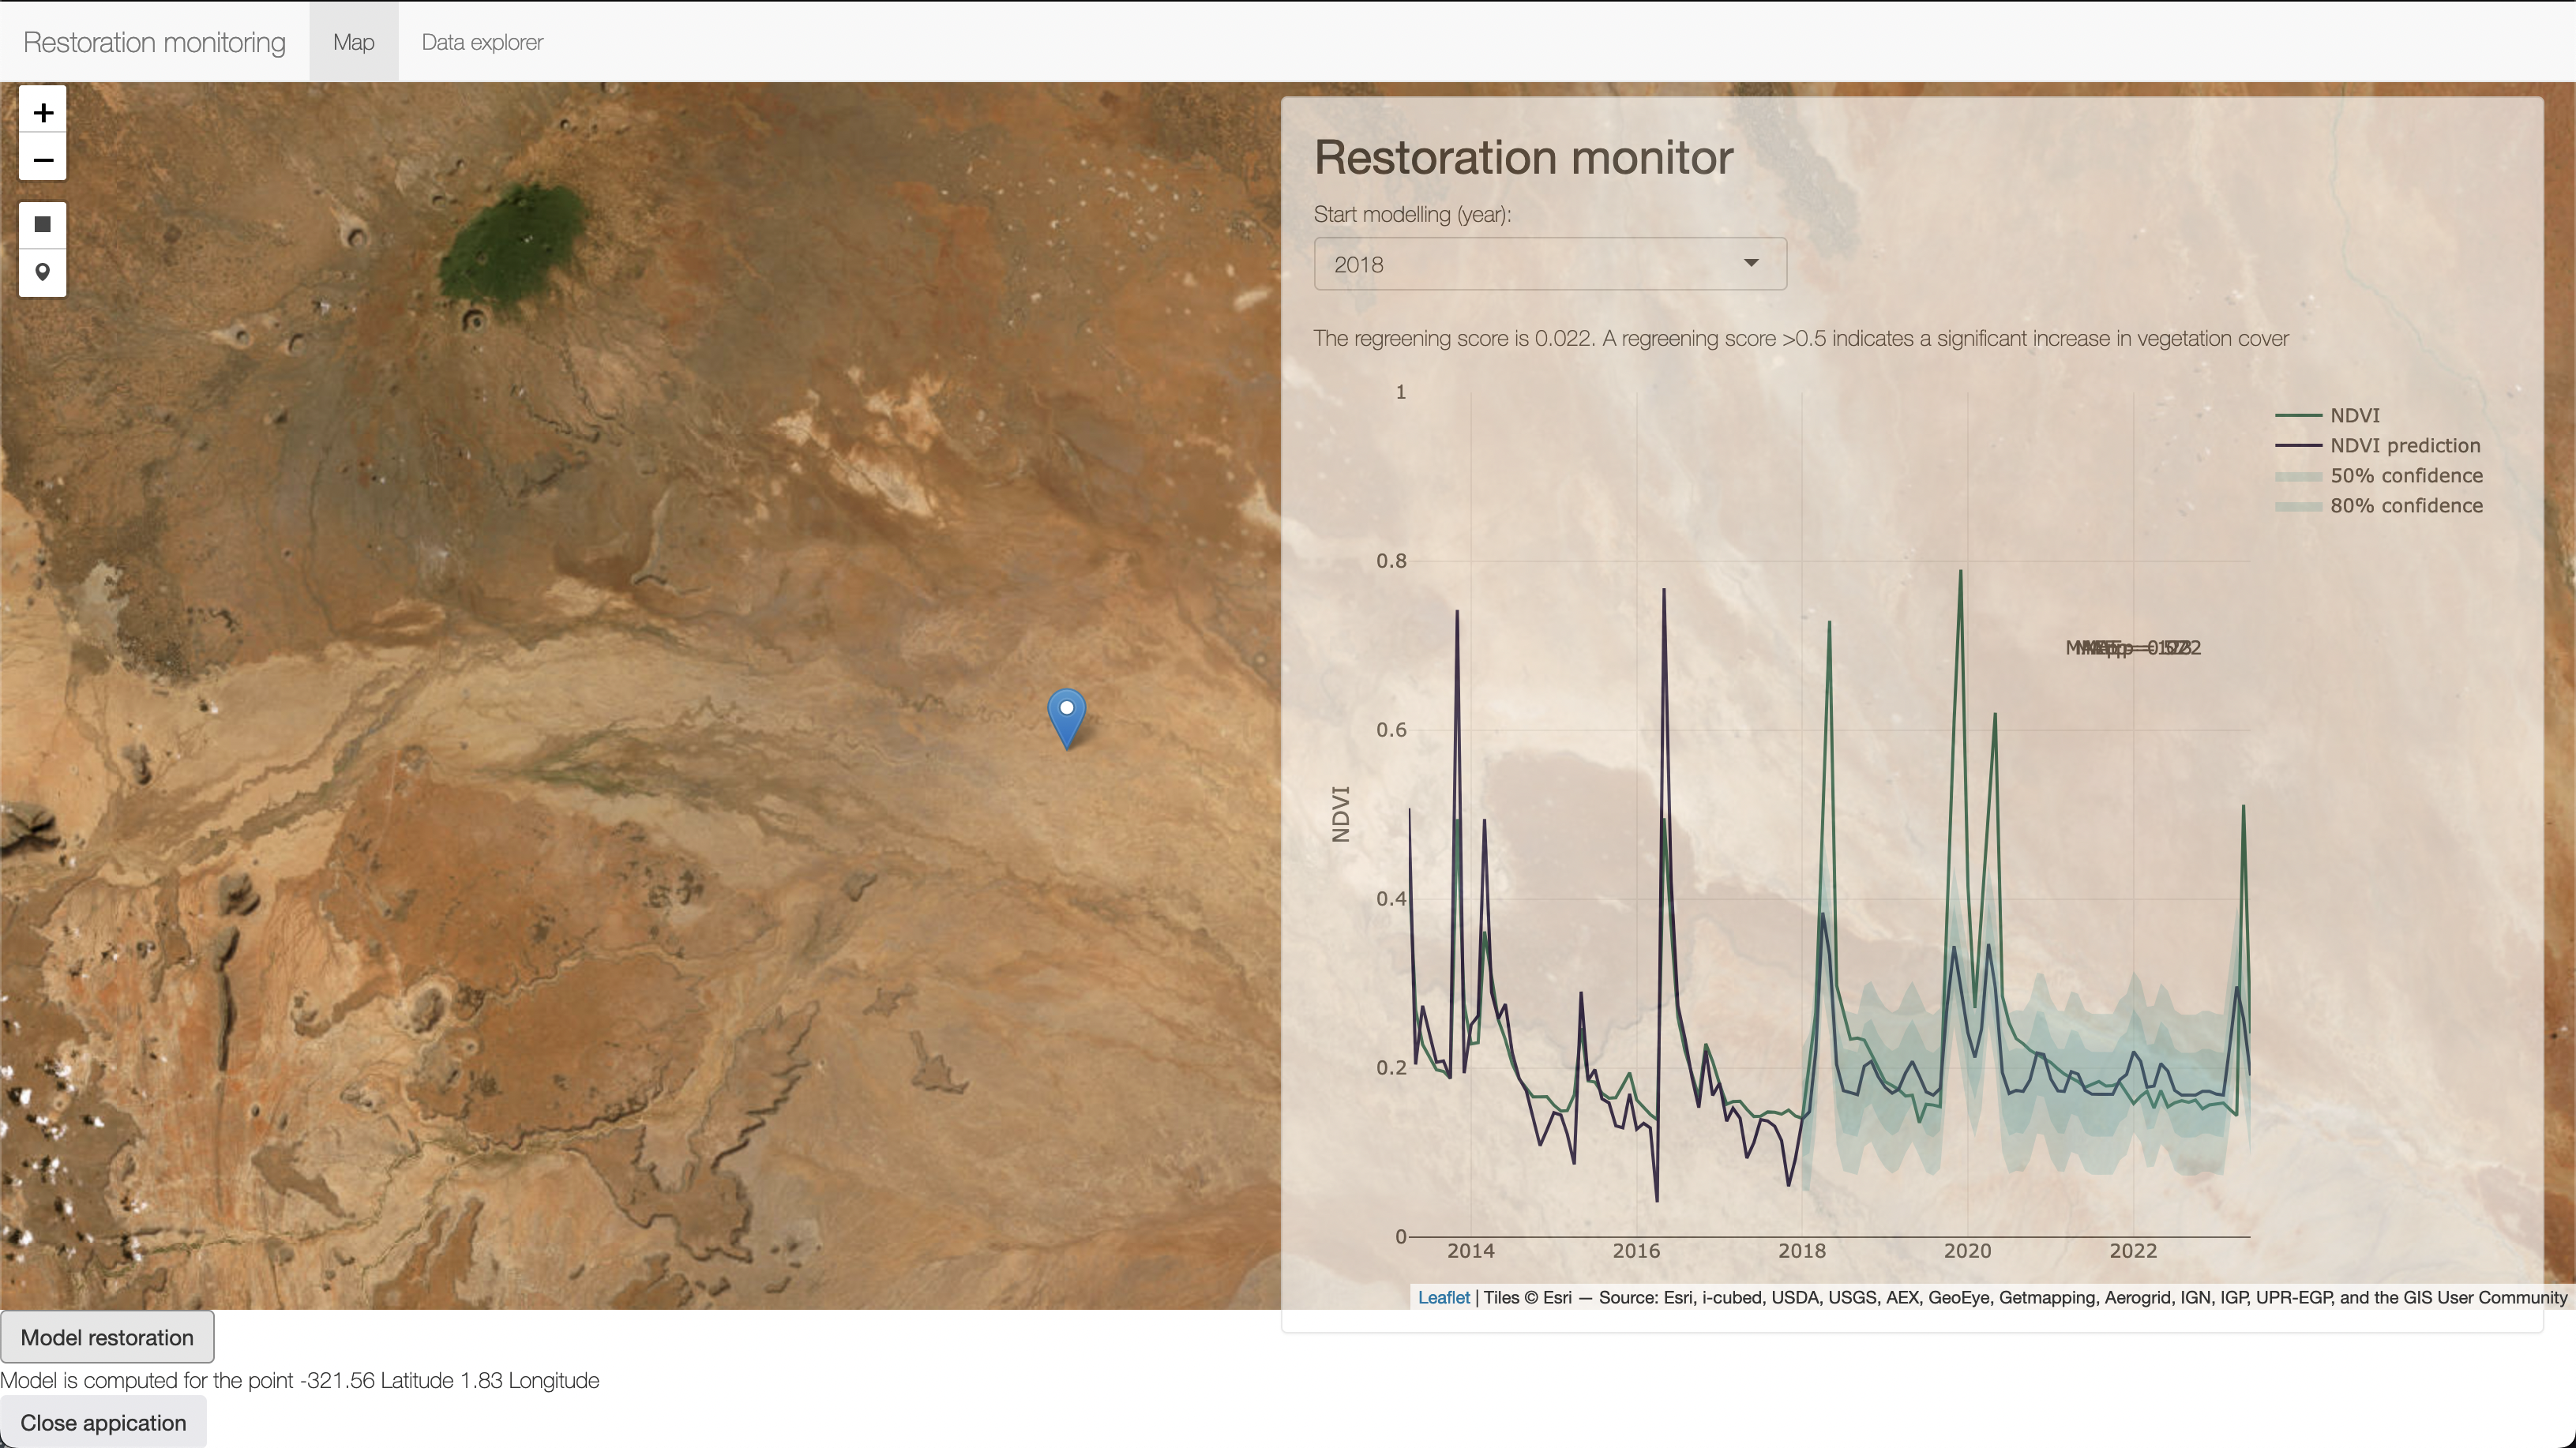
An interactive tool with global coverage to model land restoration performance by combining machine learning and the latest satellite imagery.
Launch dashboard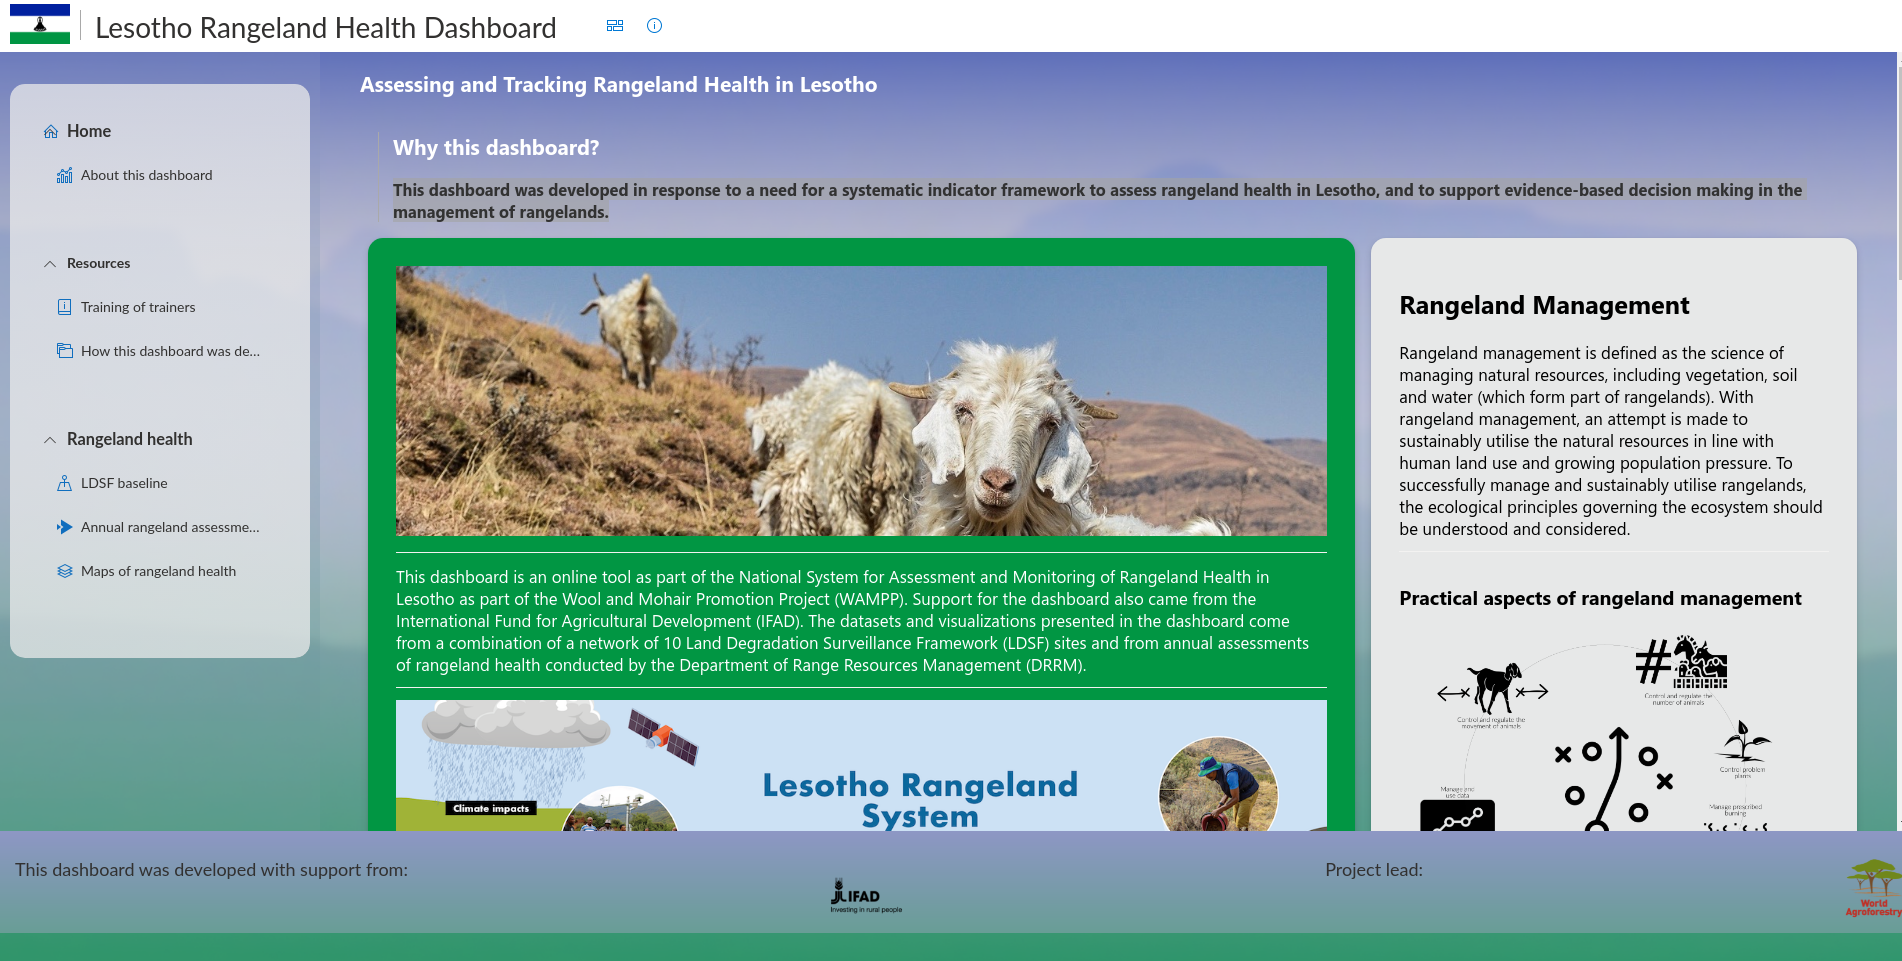
This dashboard was developed in response to a need for a systematic indicator framework to assess rangeland health in Lesotho, and to support evidence-based decision making in the mmanagement of rangelands.
Launch dashboard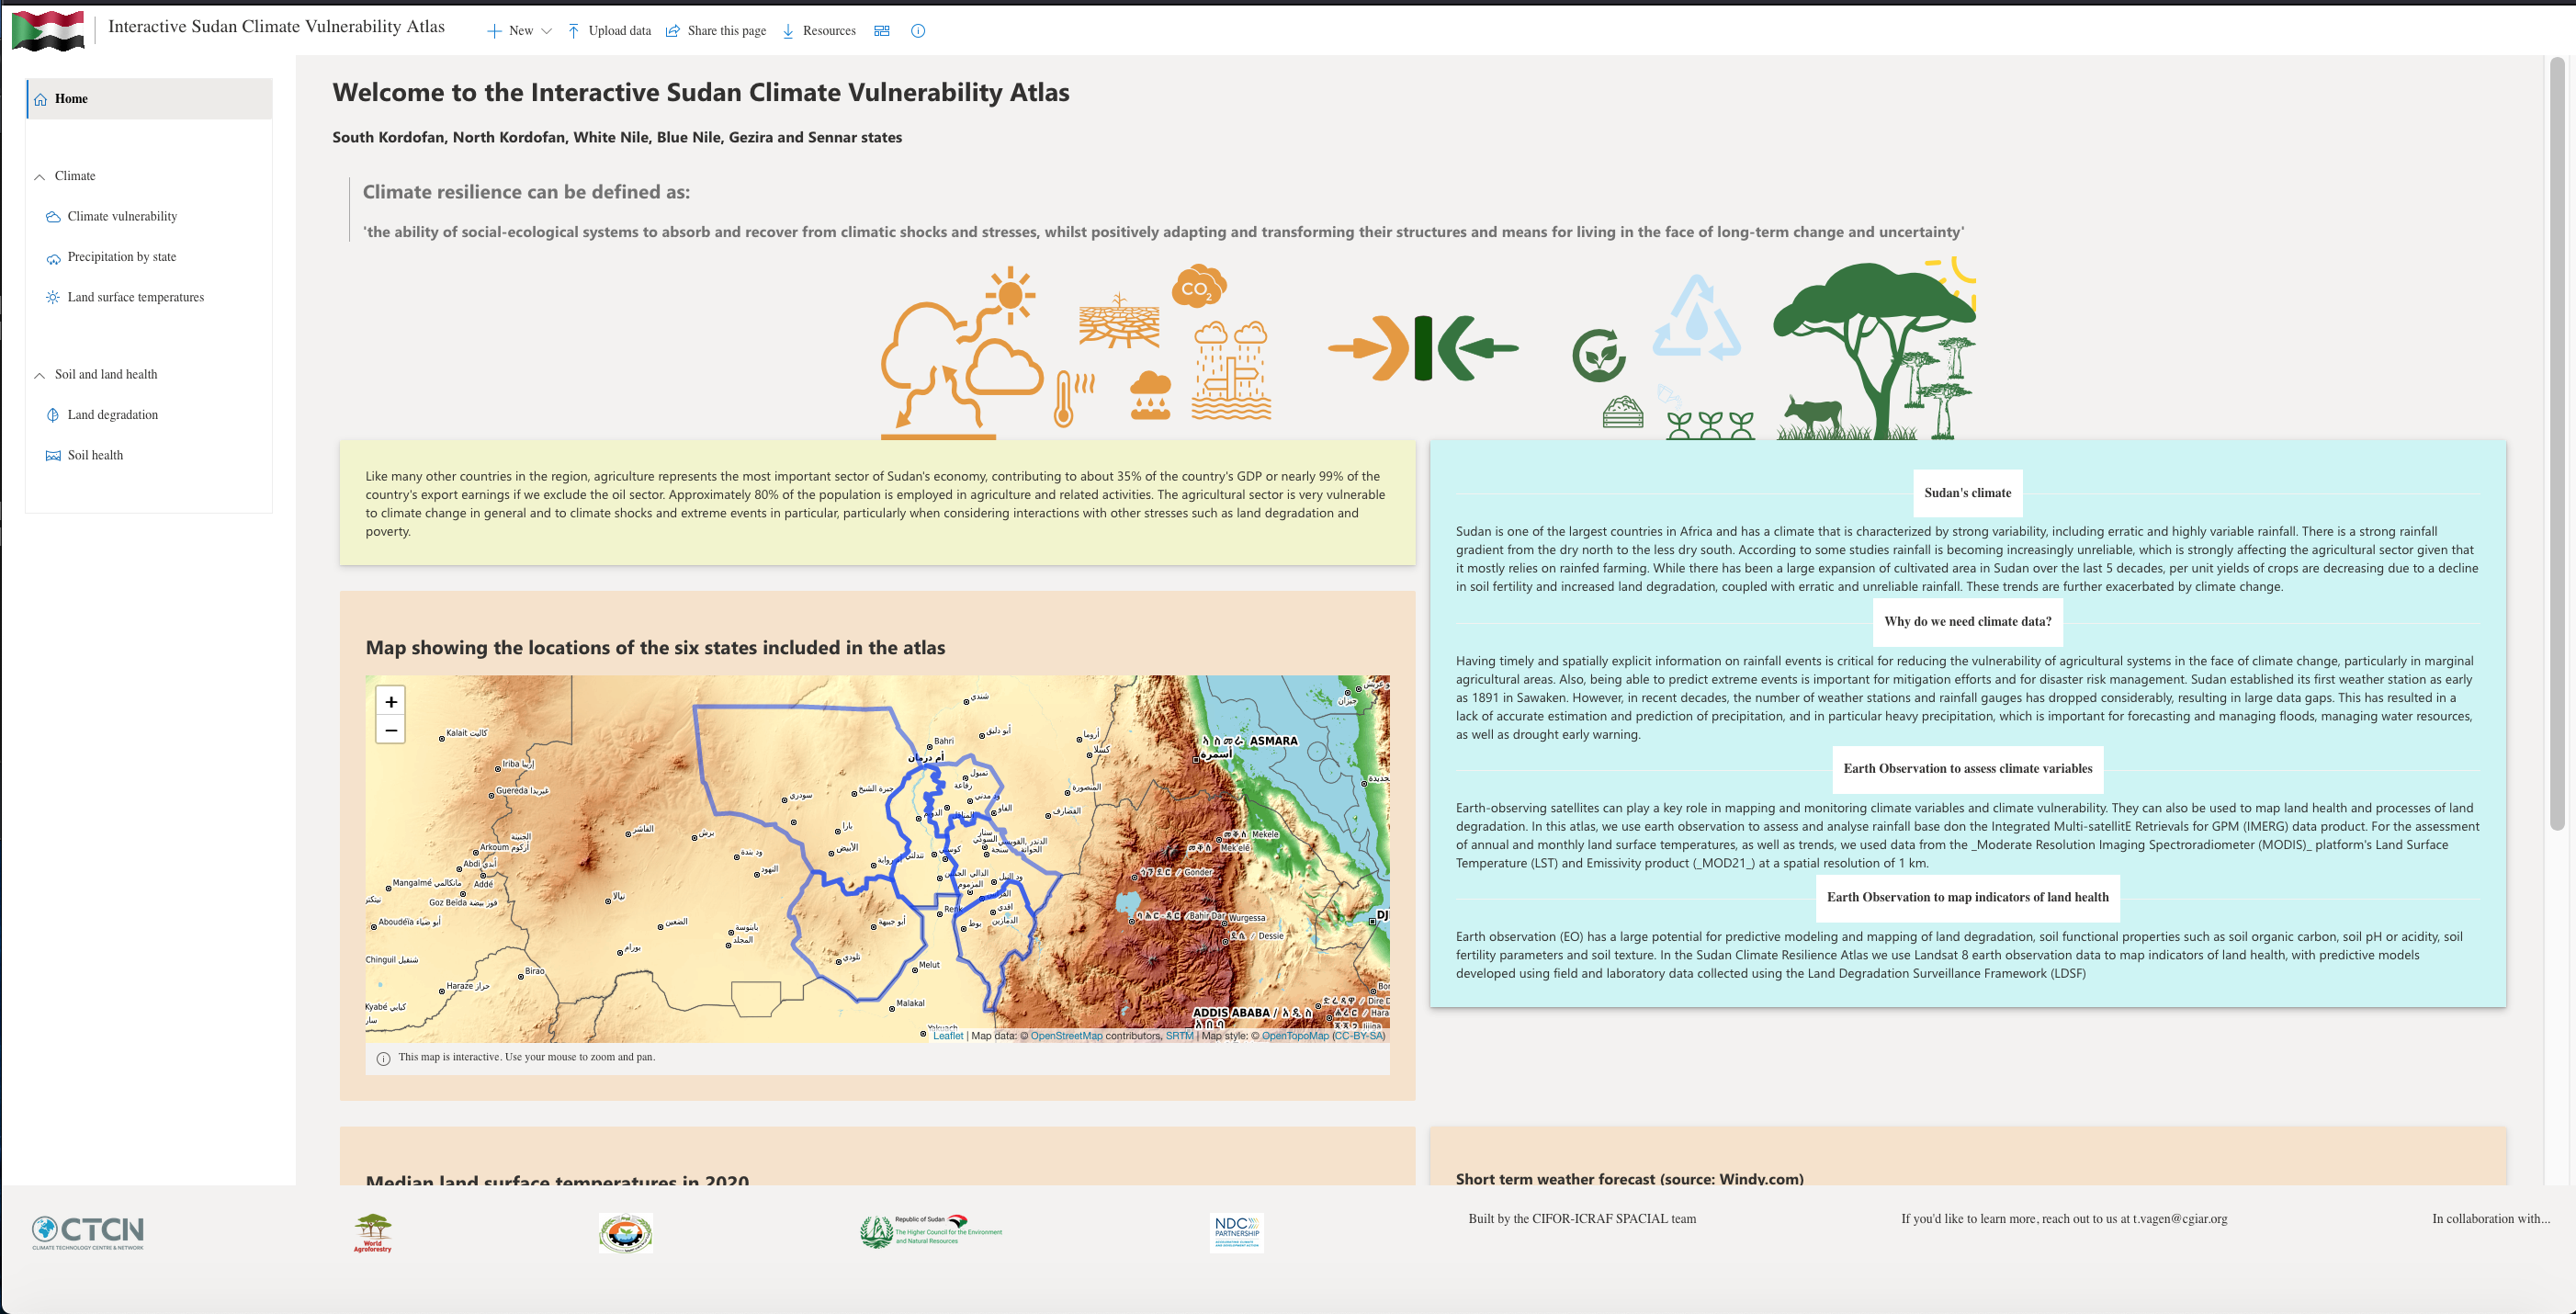
This dashboard seeks to provide timely and spatially explicit climate related data to help curb vulnerability of agricultural systems in the face of climate change in Sudan
Launch dashboard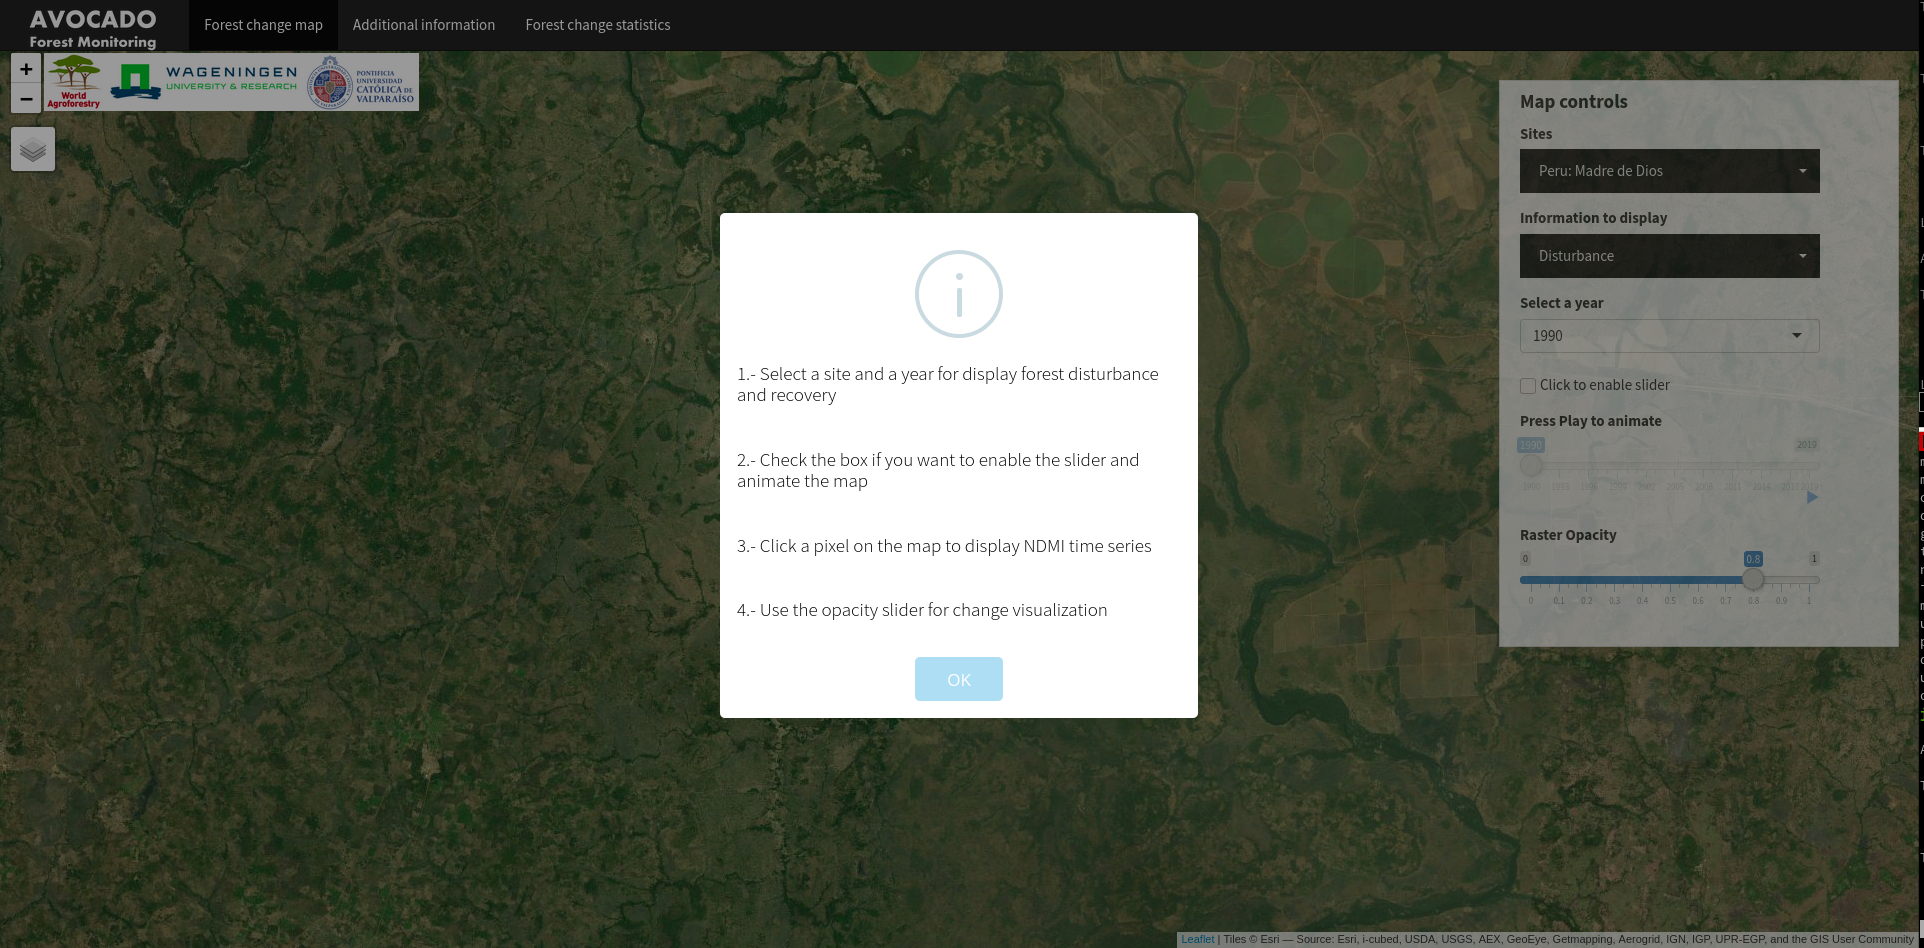
The continuous forest disturbance and regrowth monitoring AVOCADO algorithm is based on a non-parametric test and makes use of the flexibility of kernel density estimations. The kernel density estimation in the vegetation index time-space works by centering a bivariate kernel around each observation and by averaging the heights of all kernels until obtaining the final density estimation.
Launch dashboard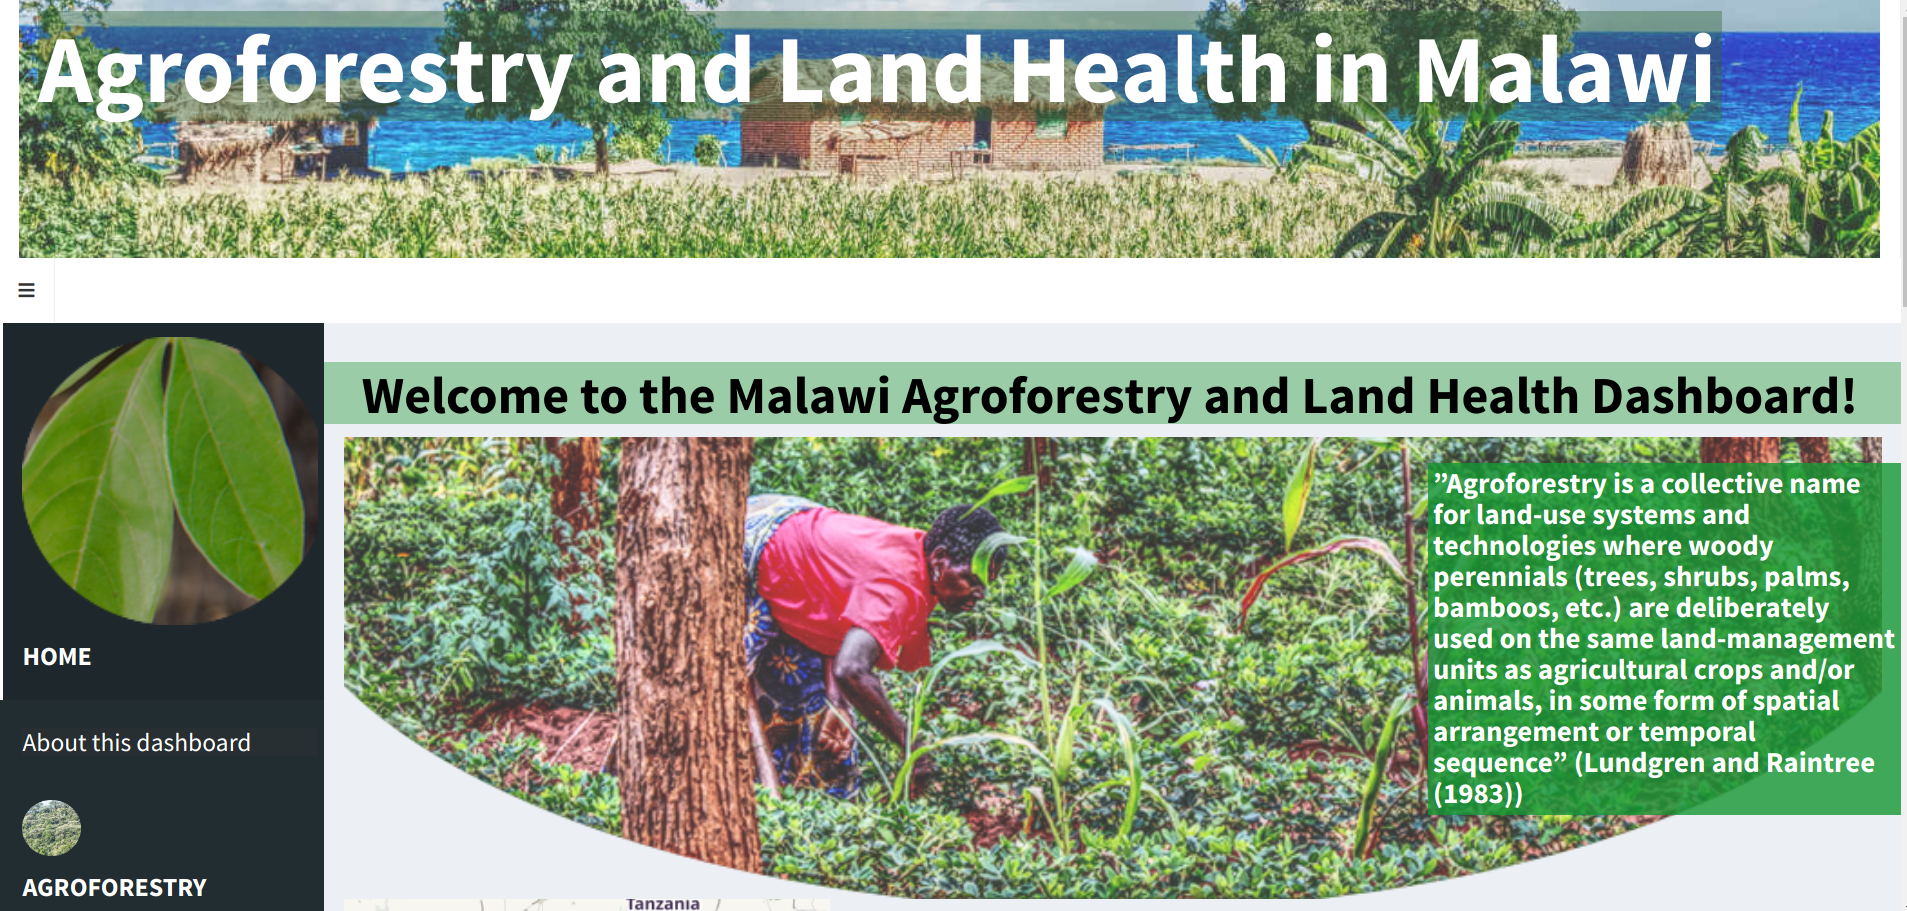
This dashboard brings data and information into a dynamic central location and can be used to monitor and track land degradation, land health status and agroforestry systems, to allow for evidence based planning and decision making.
Launch dashboard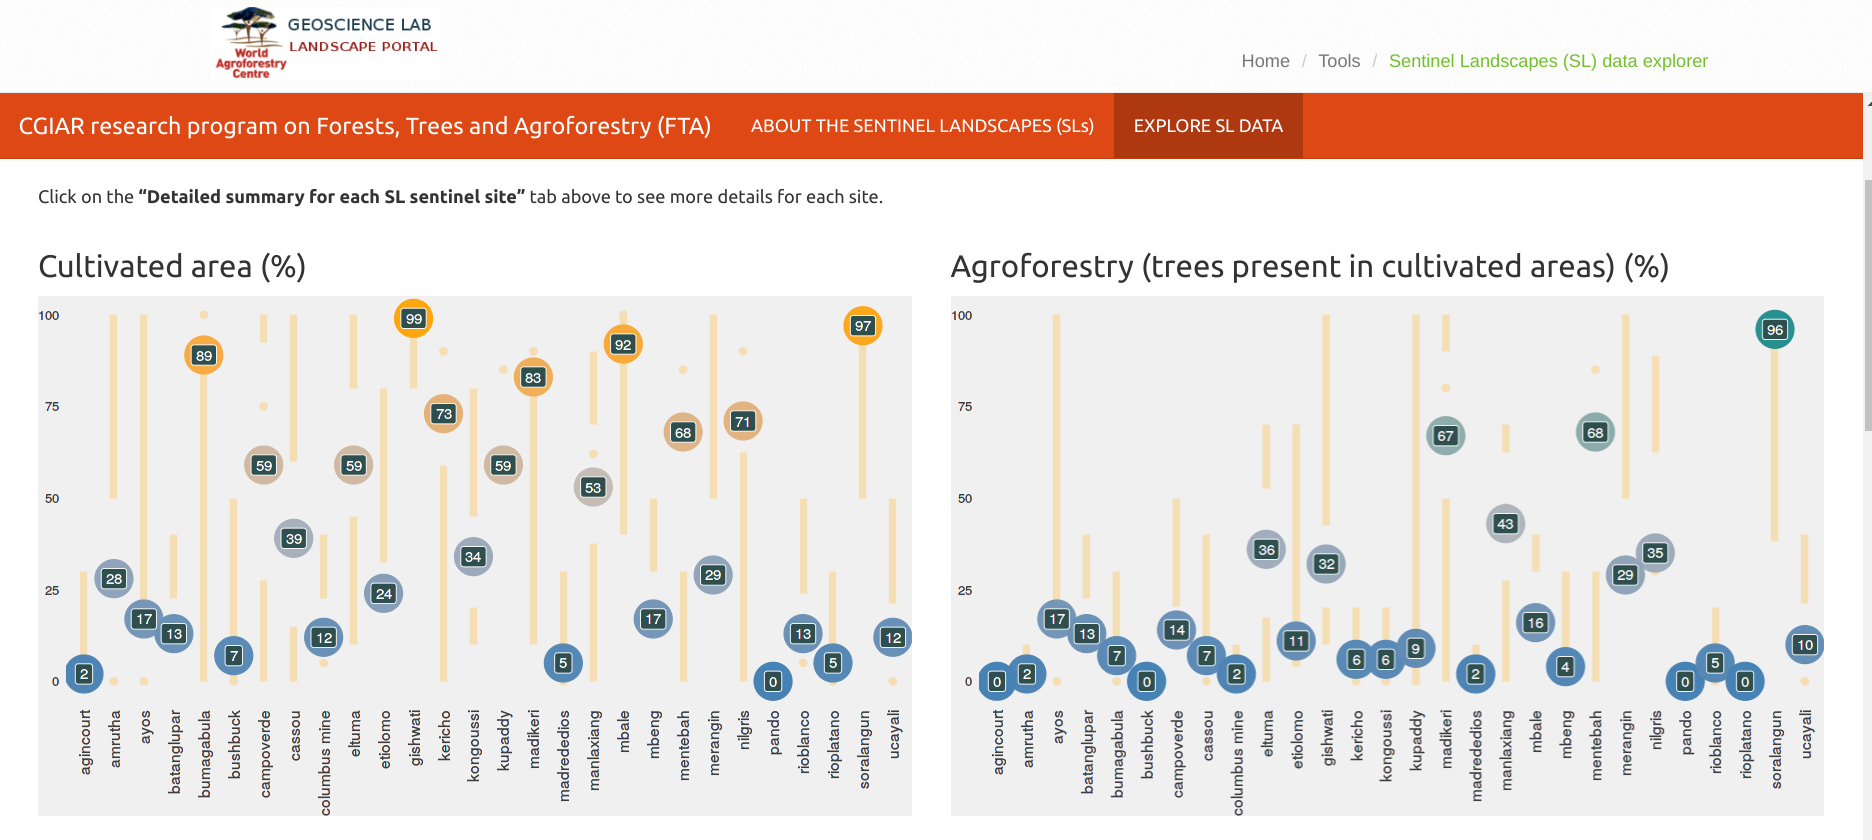
The Sentinel Landscapes (SL) initiative is comprised of geographic areas or sets of areas with a broad range of biophysical, social, economic and political conditions. A core component of the SL network is a set of Land Degradation Surveillance Framework (LDSF) sentinel sites, where intensive data collection is taking place using co-located biophysical and socio-economic surveys in order to collect information on a number of social-ecological indicators.
Launch dashboard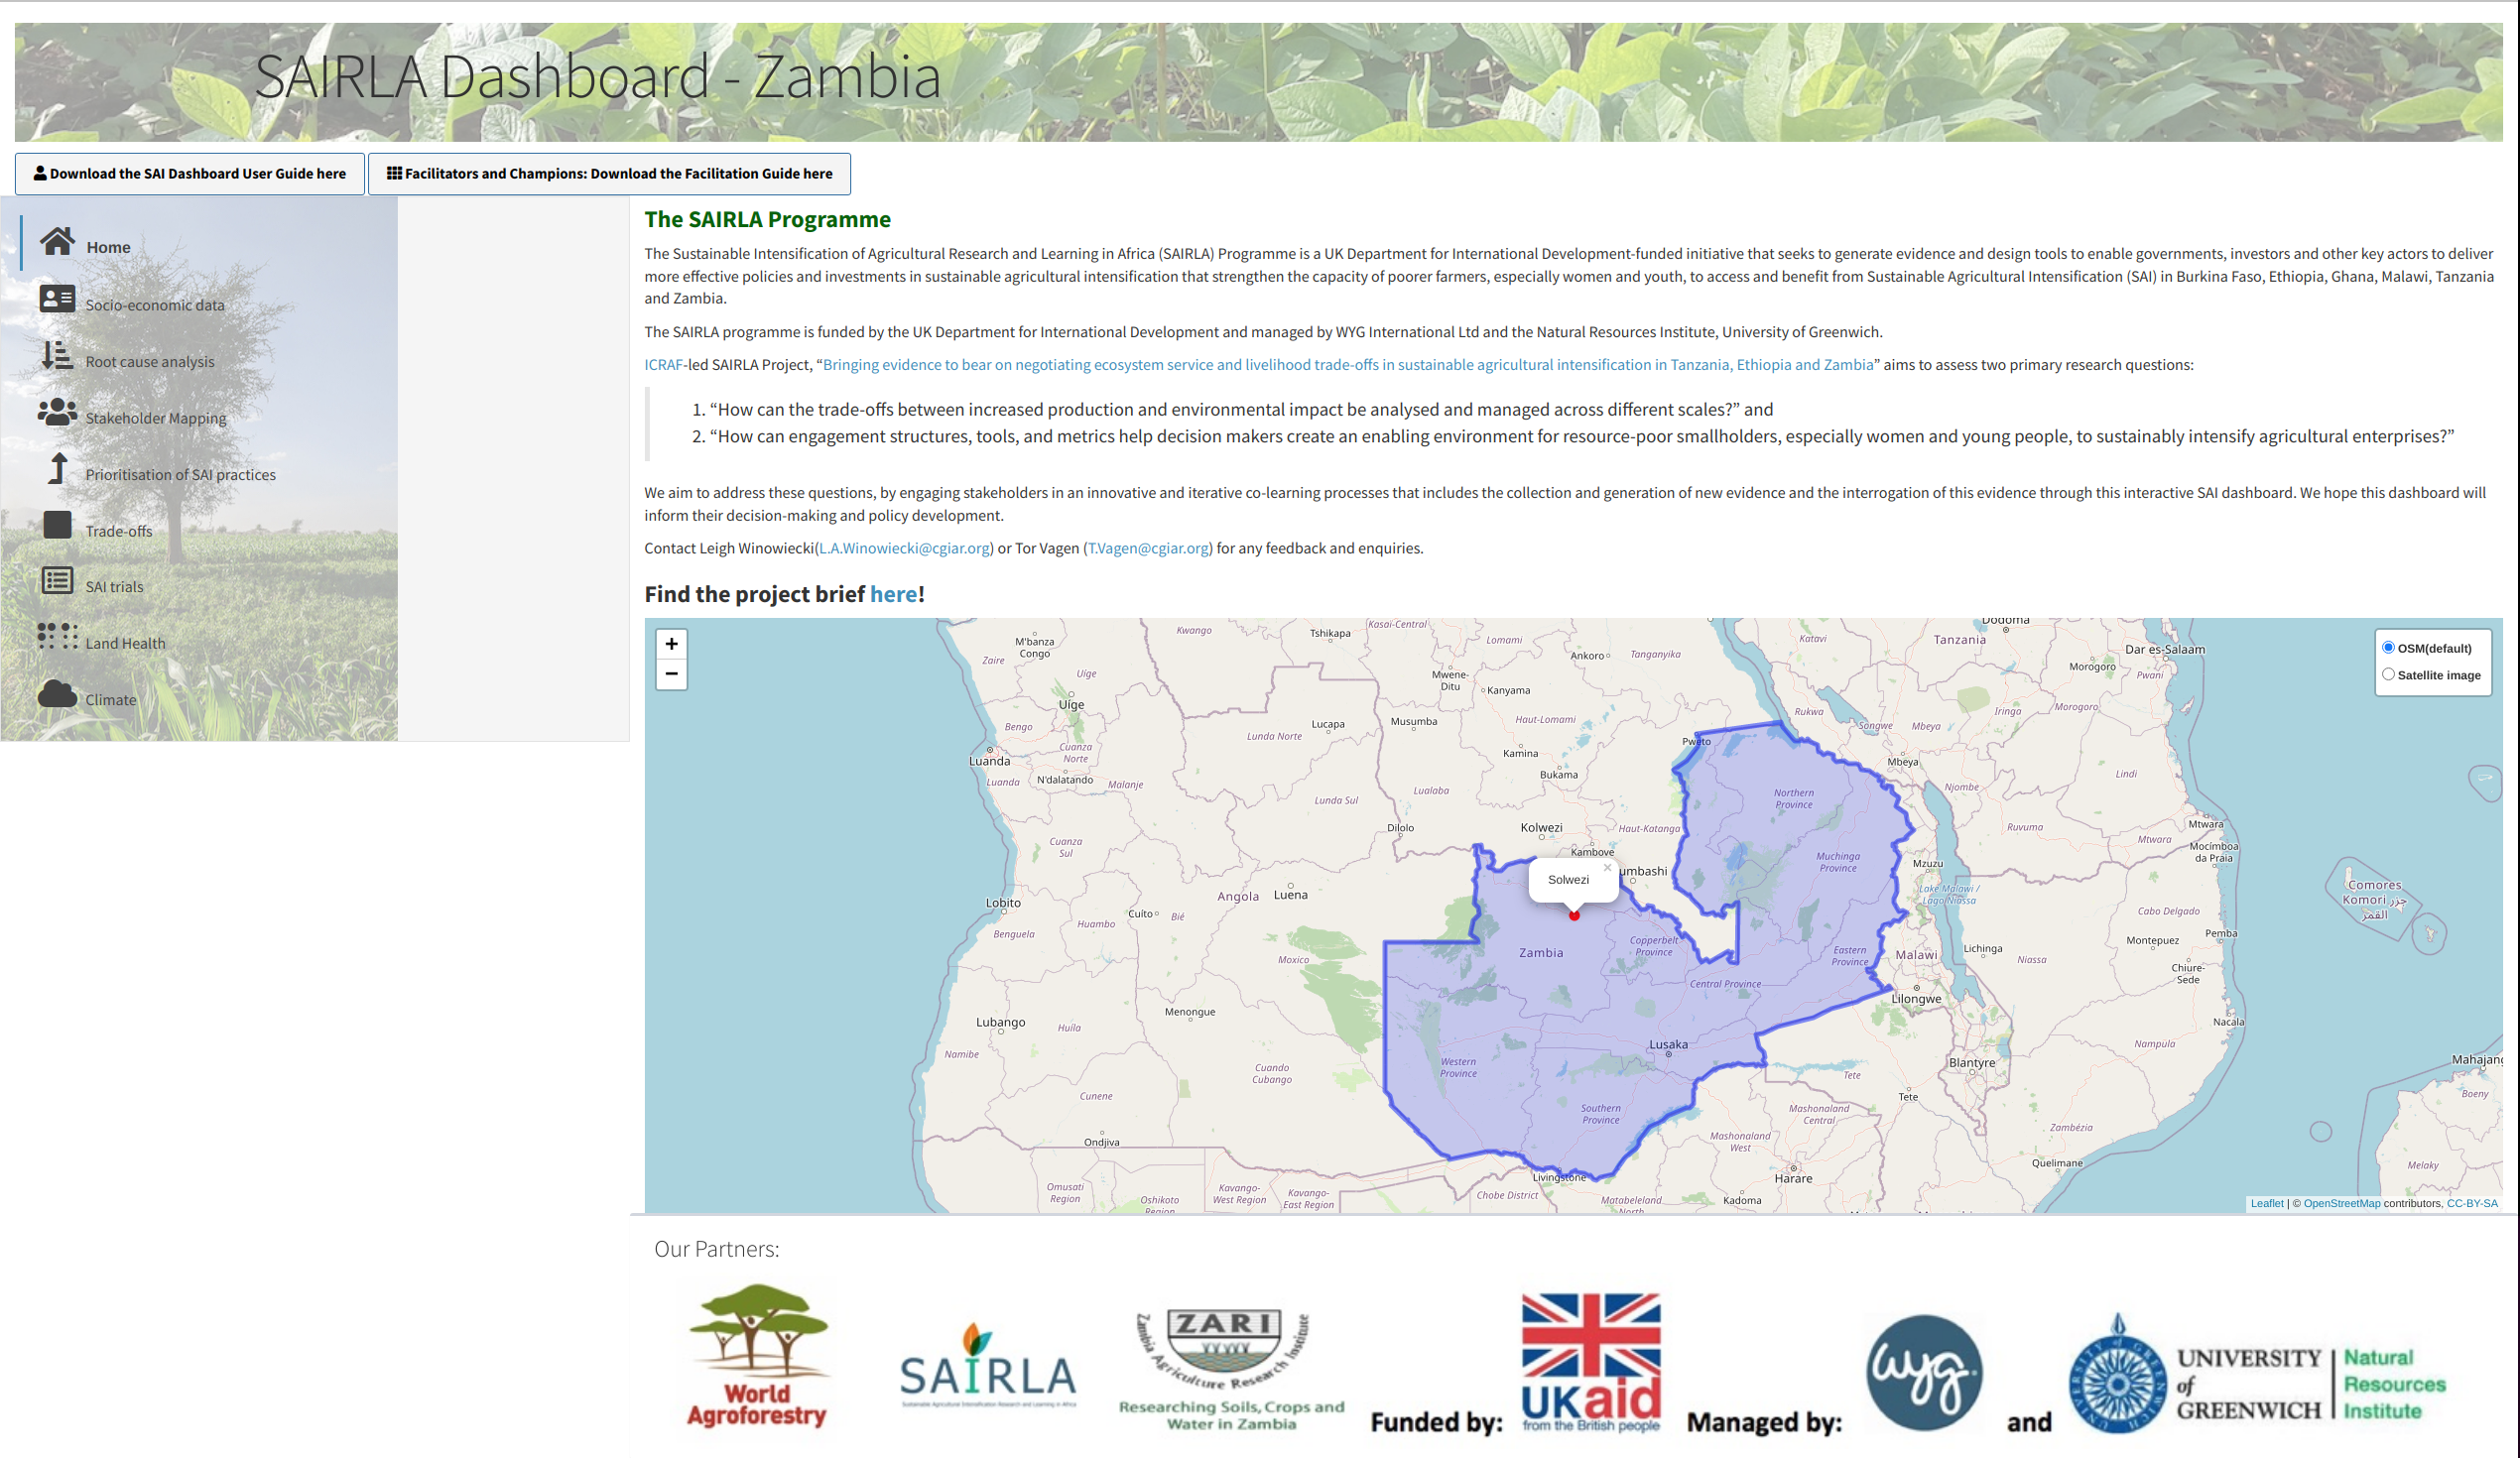
Interactive SAi (Sustainable Agricultural Intensification) dashboard for Zambia developed under the Sustainable Intensification of Agricultural Research and Learning in Africa program. The project seeks to generate evidence and design tools to enable governments, investors and other key actors to deliver more effective policies and investments in sustainable agricultural intensification that strengthen the capacity of poorer farmers, especially women and youth, to access and benefit from SAI in Burkina Faso, Ethiopia, Ghana, Malawi, Tanzania and Zambia.
Launch dashboard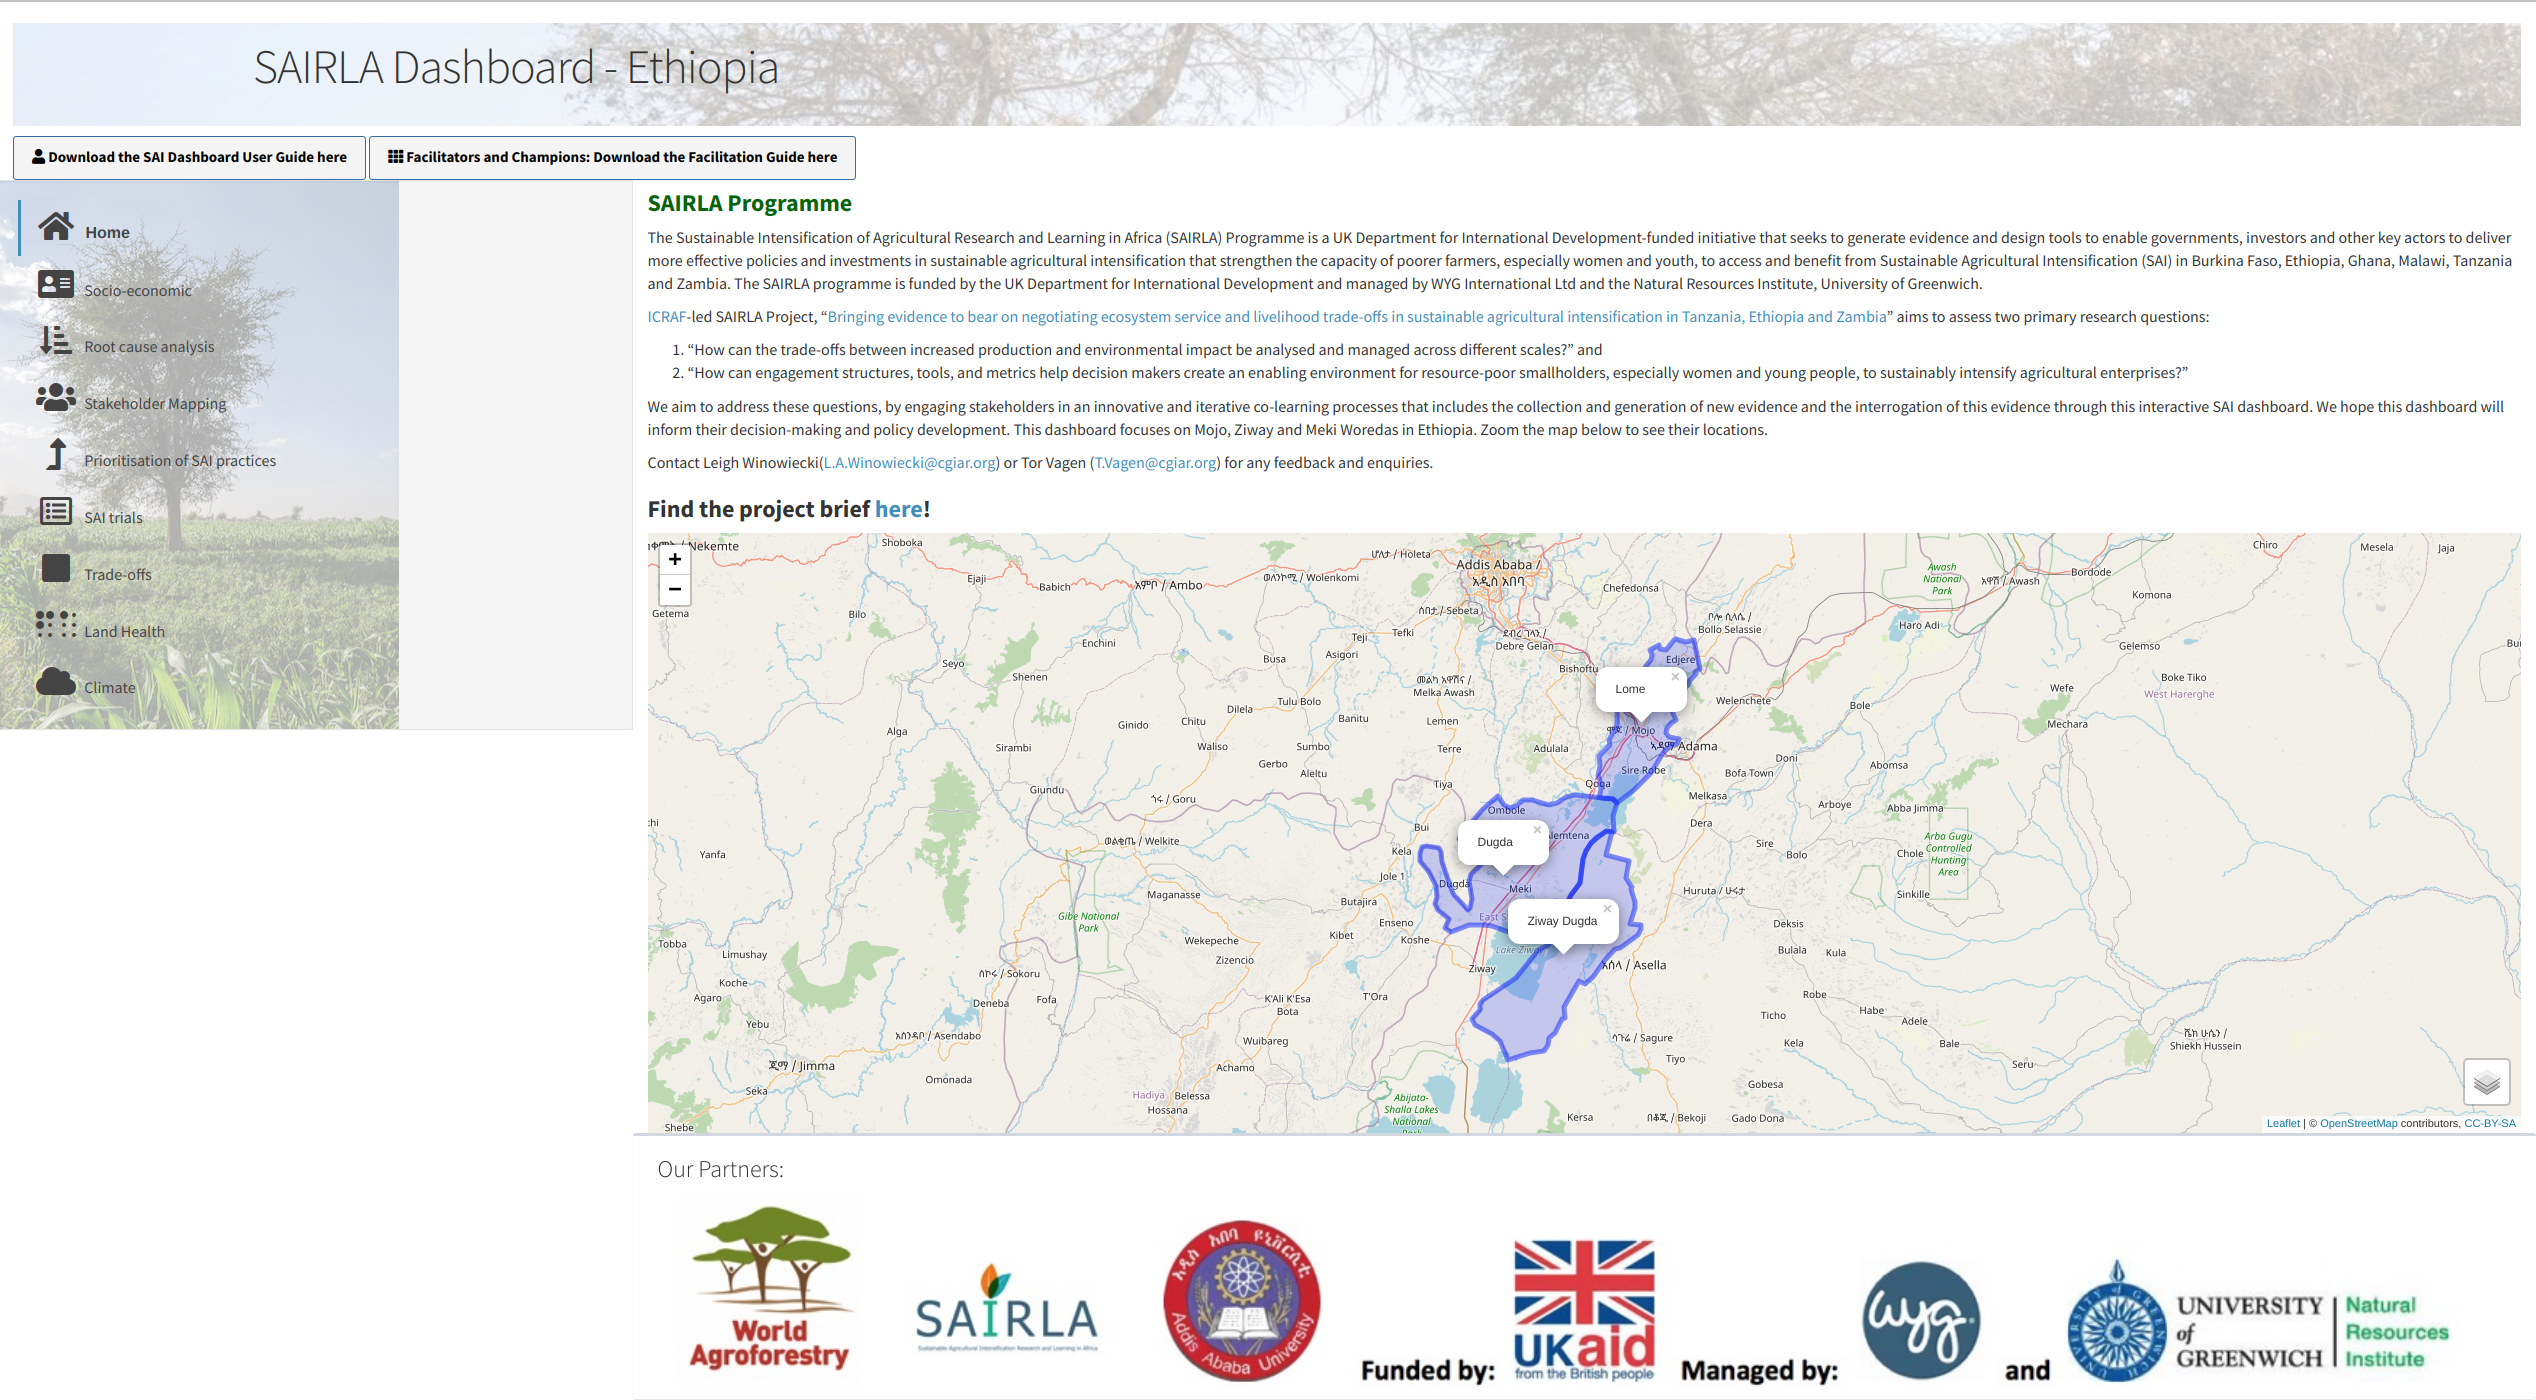
Interactive SAI (Sustainable Agricultural Intensification) dashboard for Ethiopia developed under the Sustainable Intensification of Agriculture Research and Learning in Africa program. The project seeks to generate evidence and design tools to enable governments, investors and other key actors to deliver more effective policies and investments in sustainable agricultural intensification that strengthen the capacity of poorer farmers, especially women and youth, to access and benefit from Sustainable Agricultural Intensification in Burkina Faso, Ethiopia, Ghana, Malawi, Tanzania and Zambia.
Launch dashboard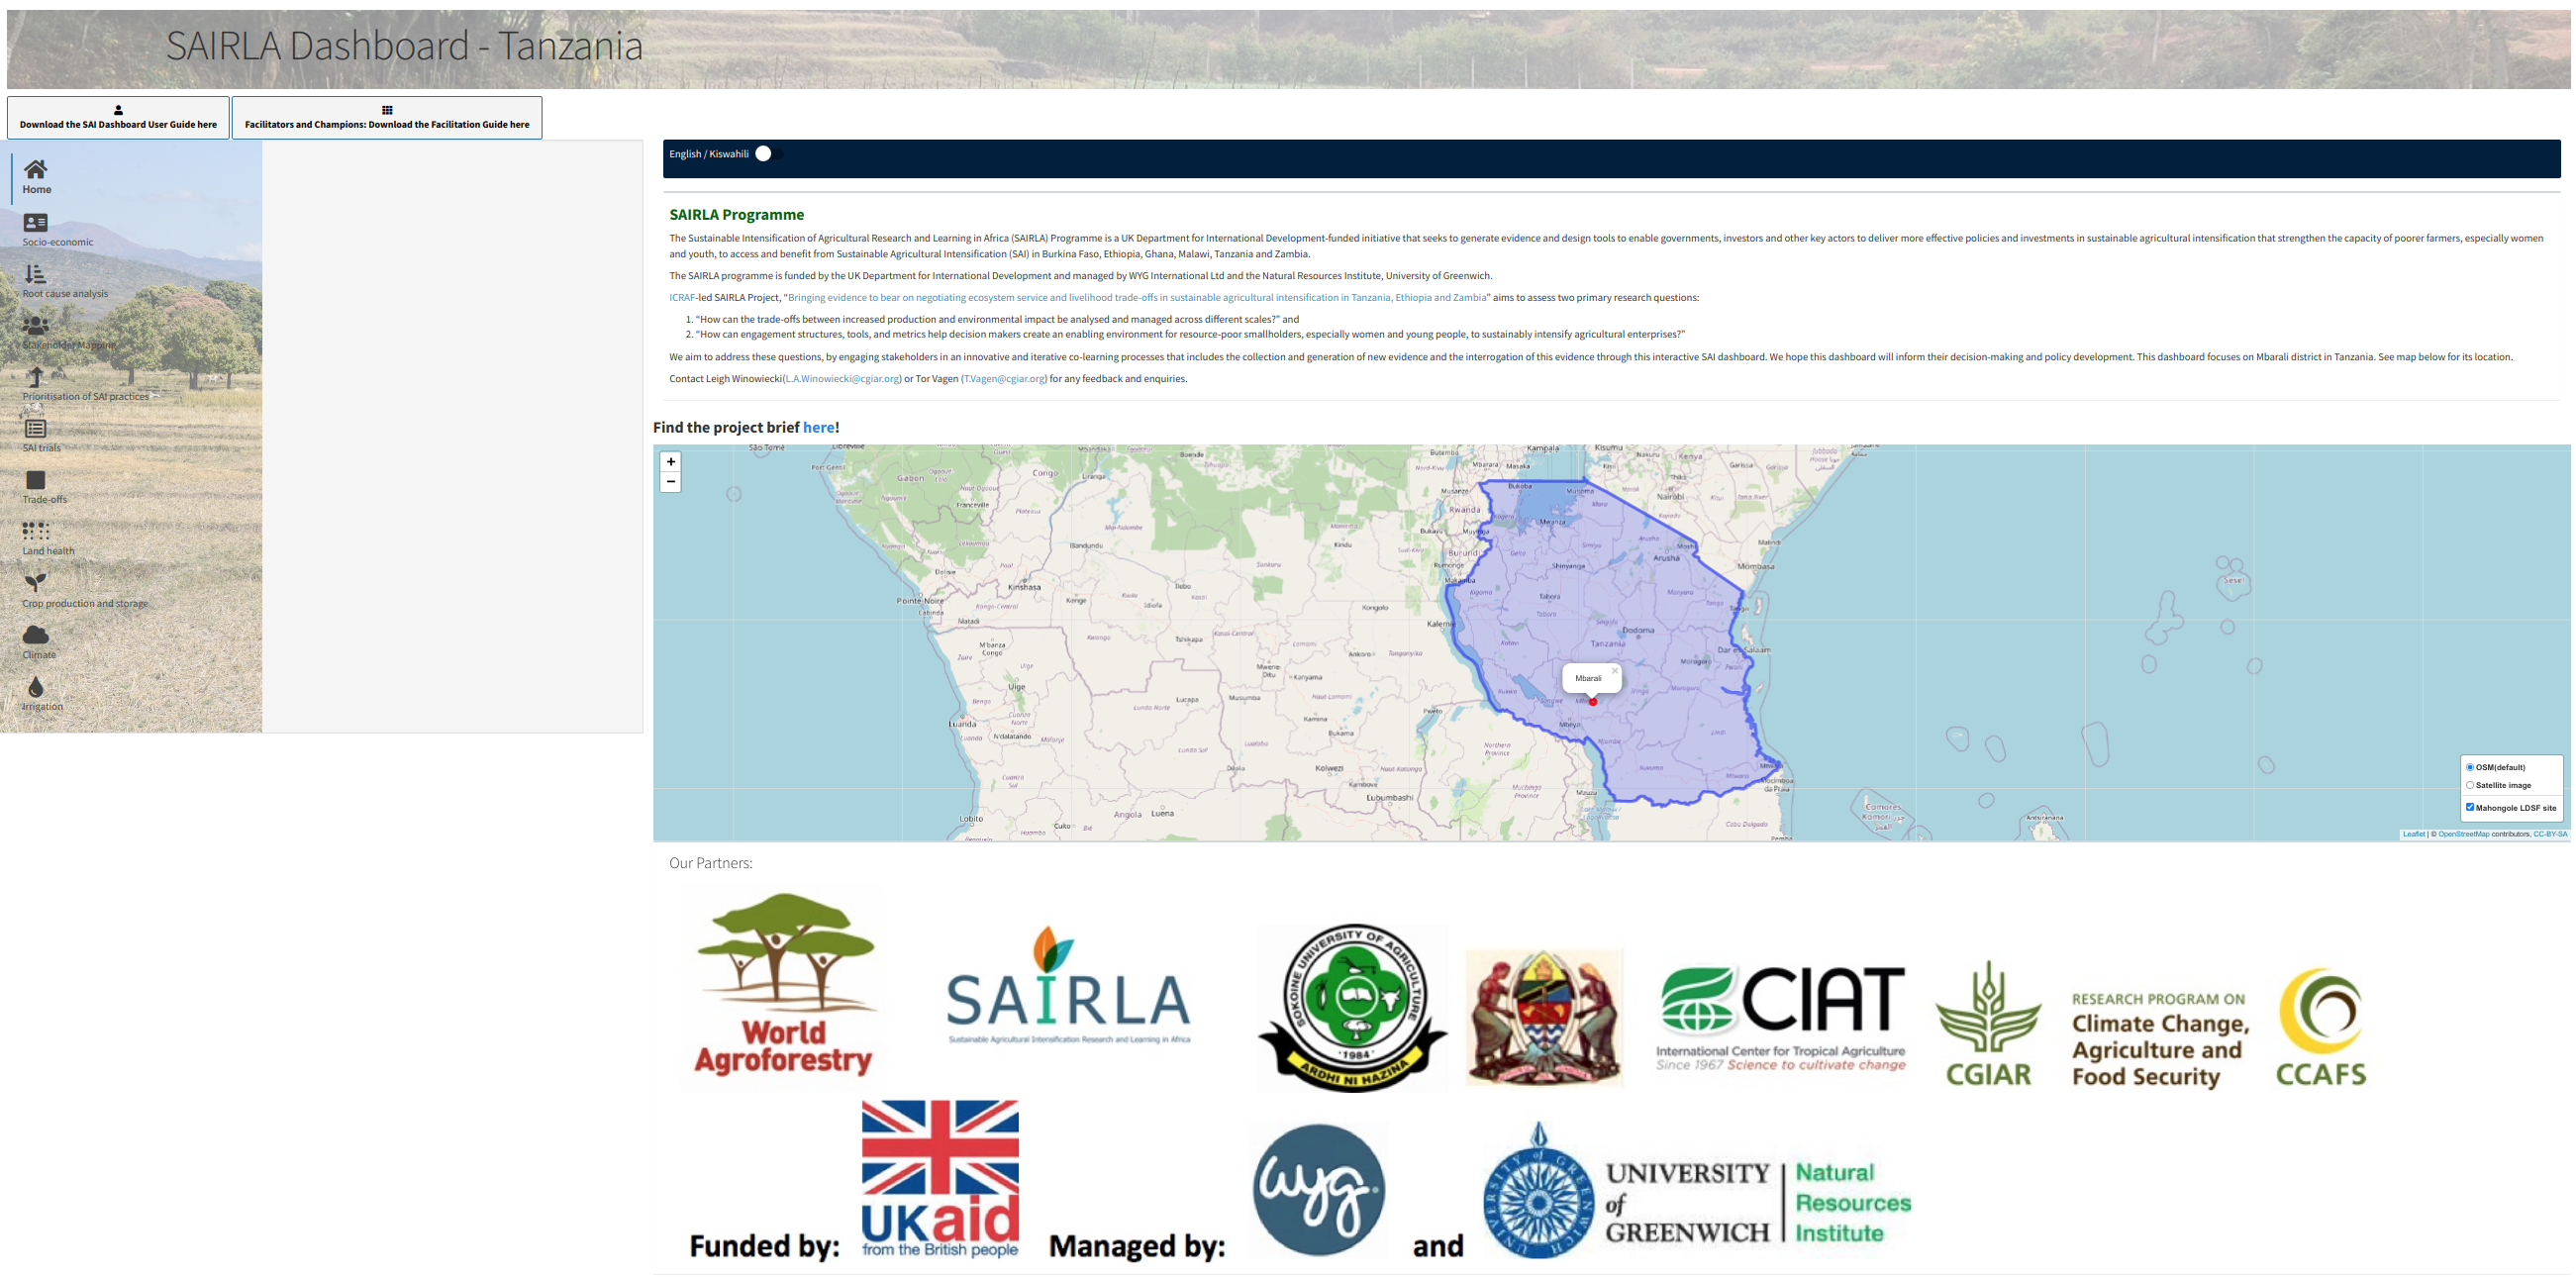
Interactive SAI(Sustainable Agricultural Intensification) dashboard for Tanzania that was developed under the Sustainable Intensification of Agricutural Research and Learning in Africa program.
Launch dashboard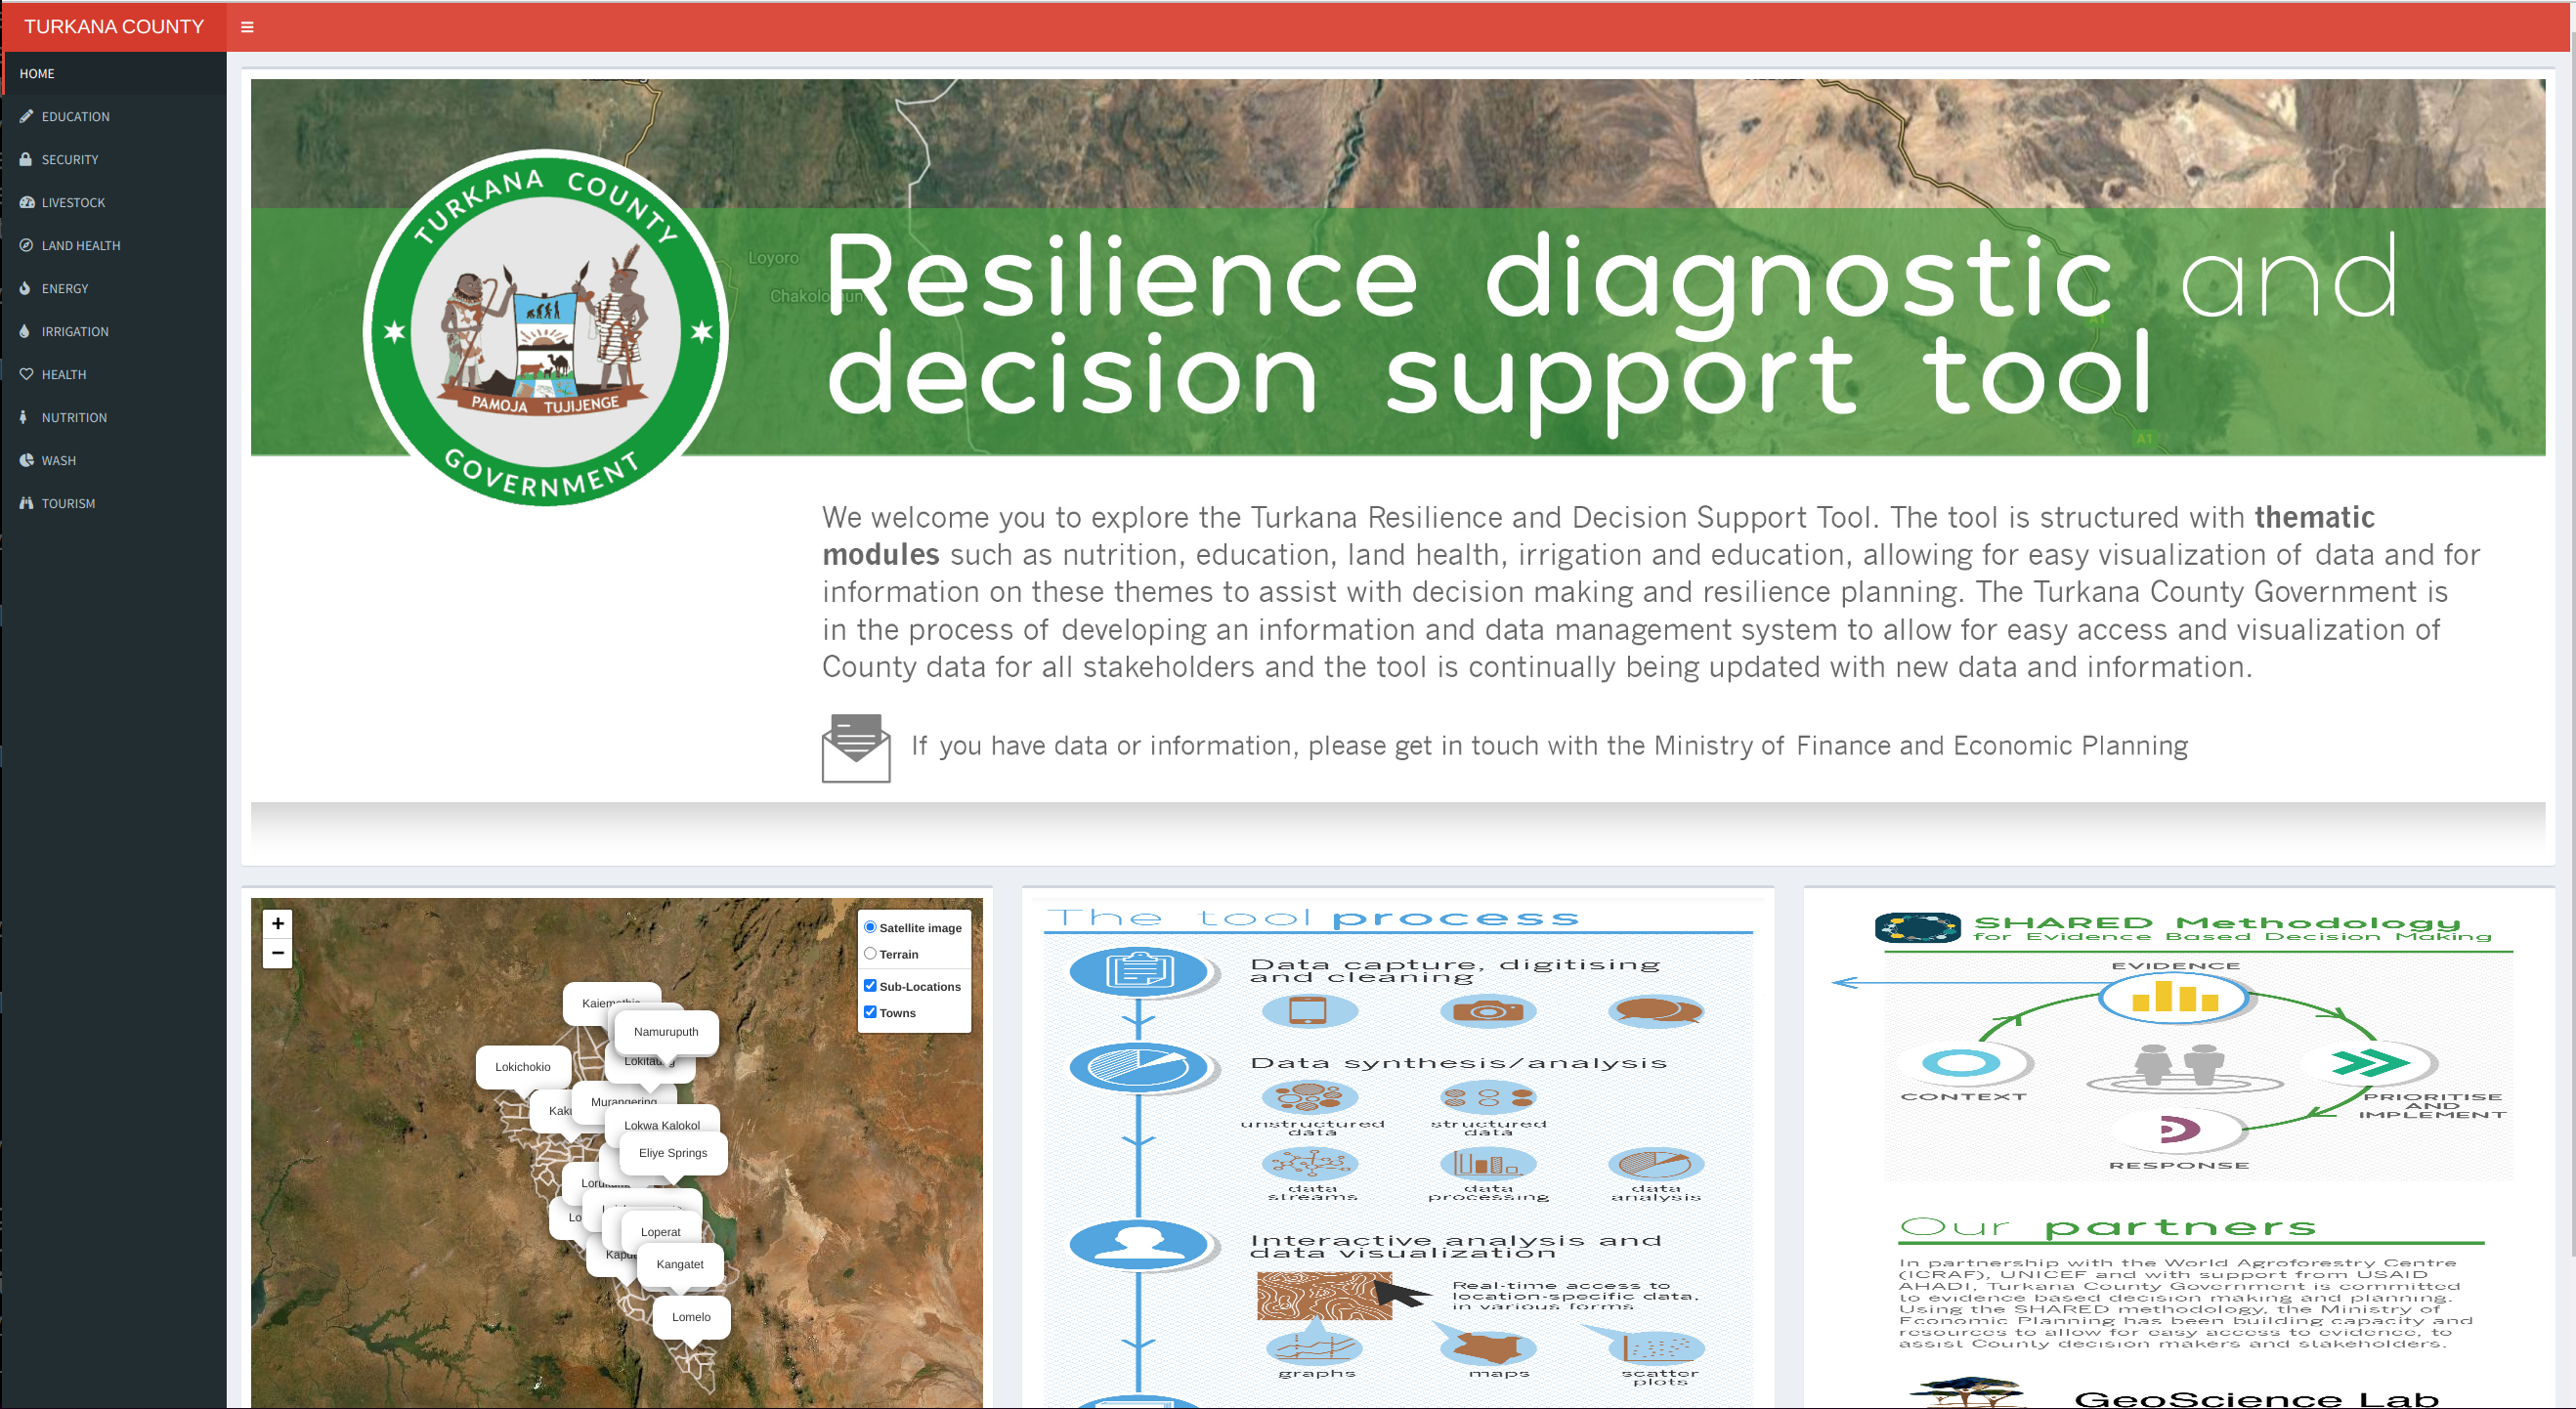
Turkana County dashboard was developed to support informed decision making at various scales within the County.
Launch dashboard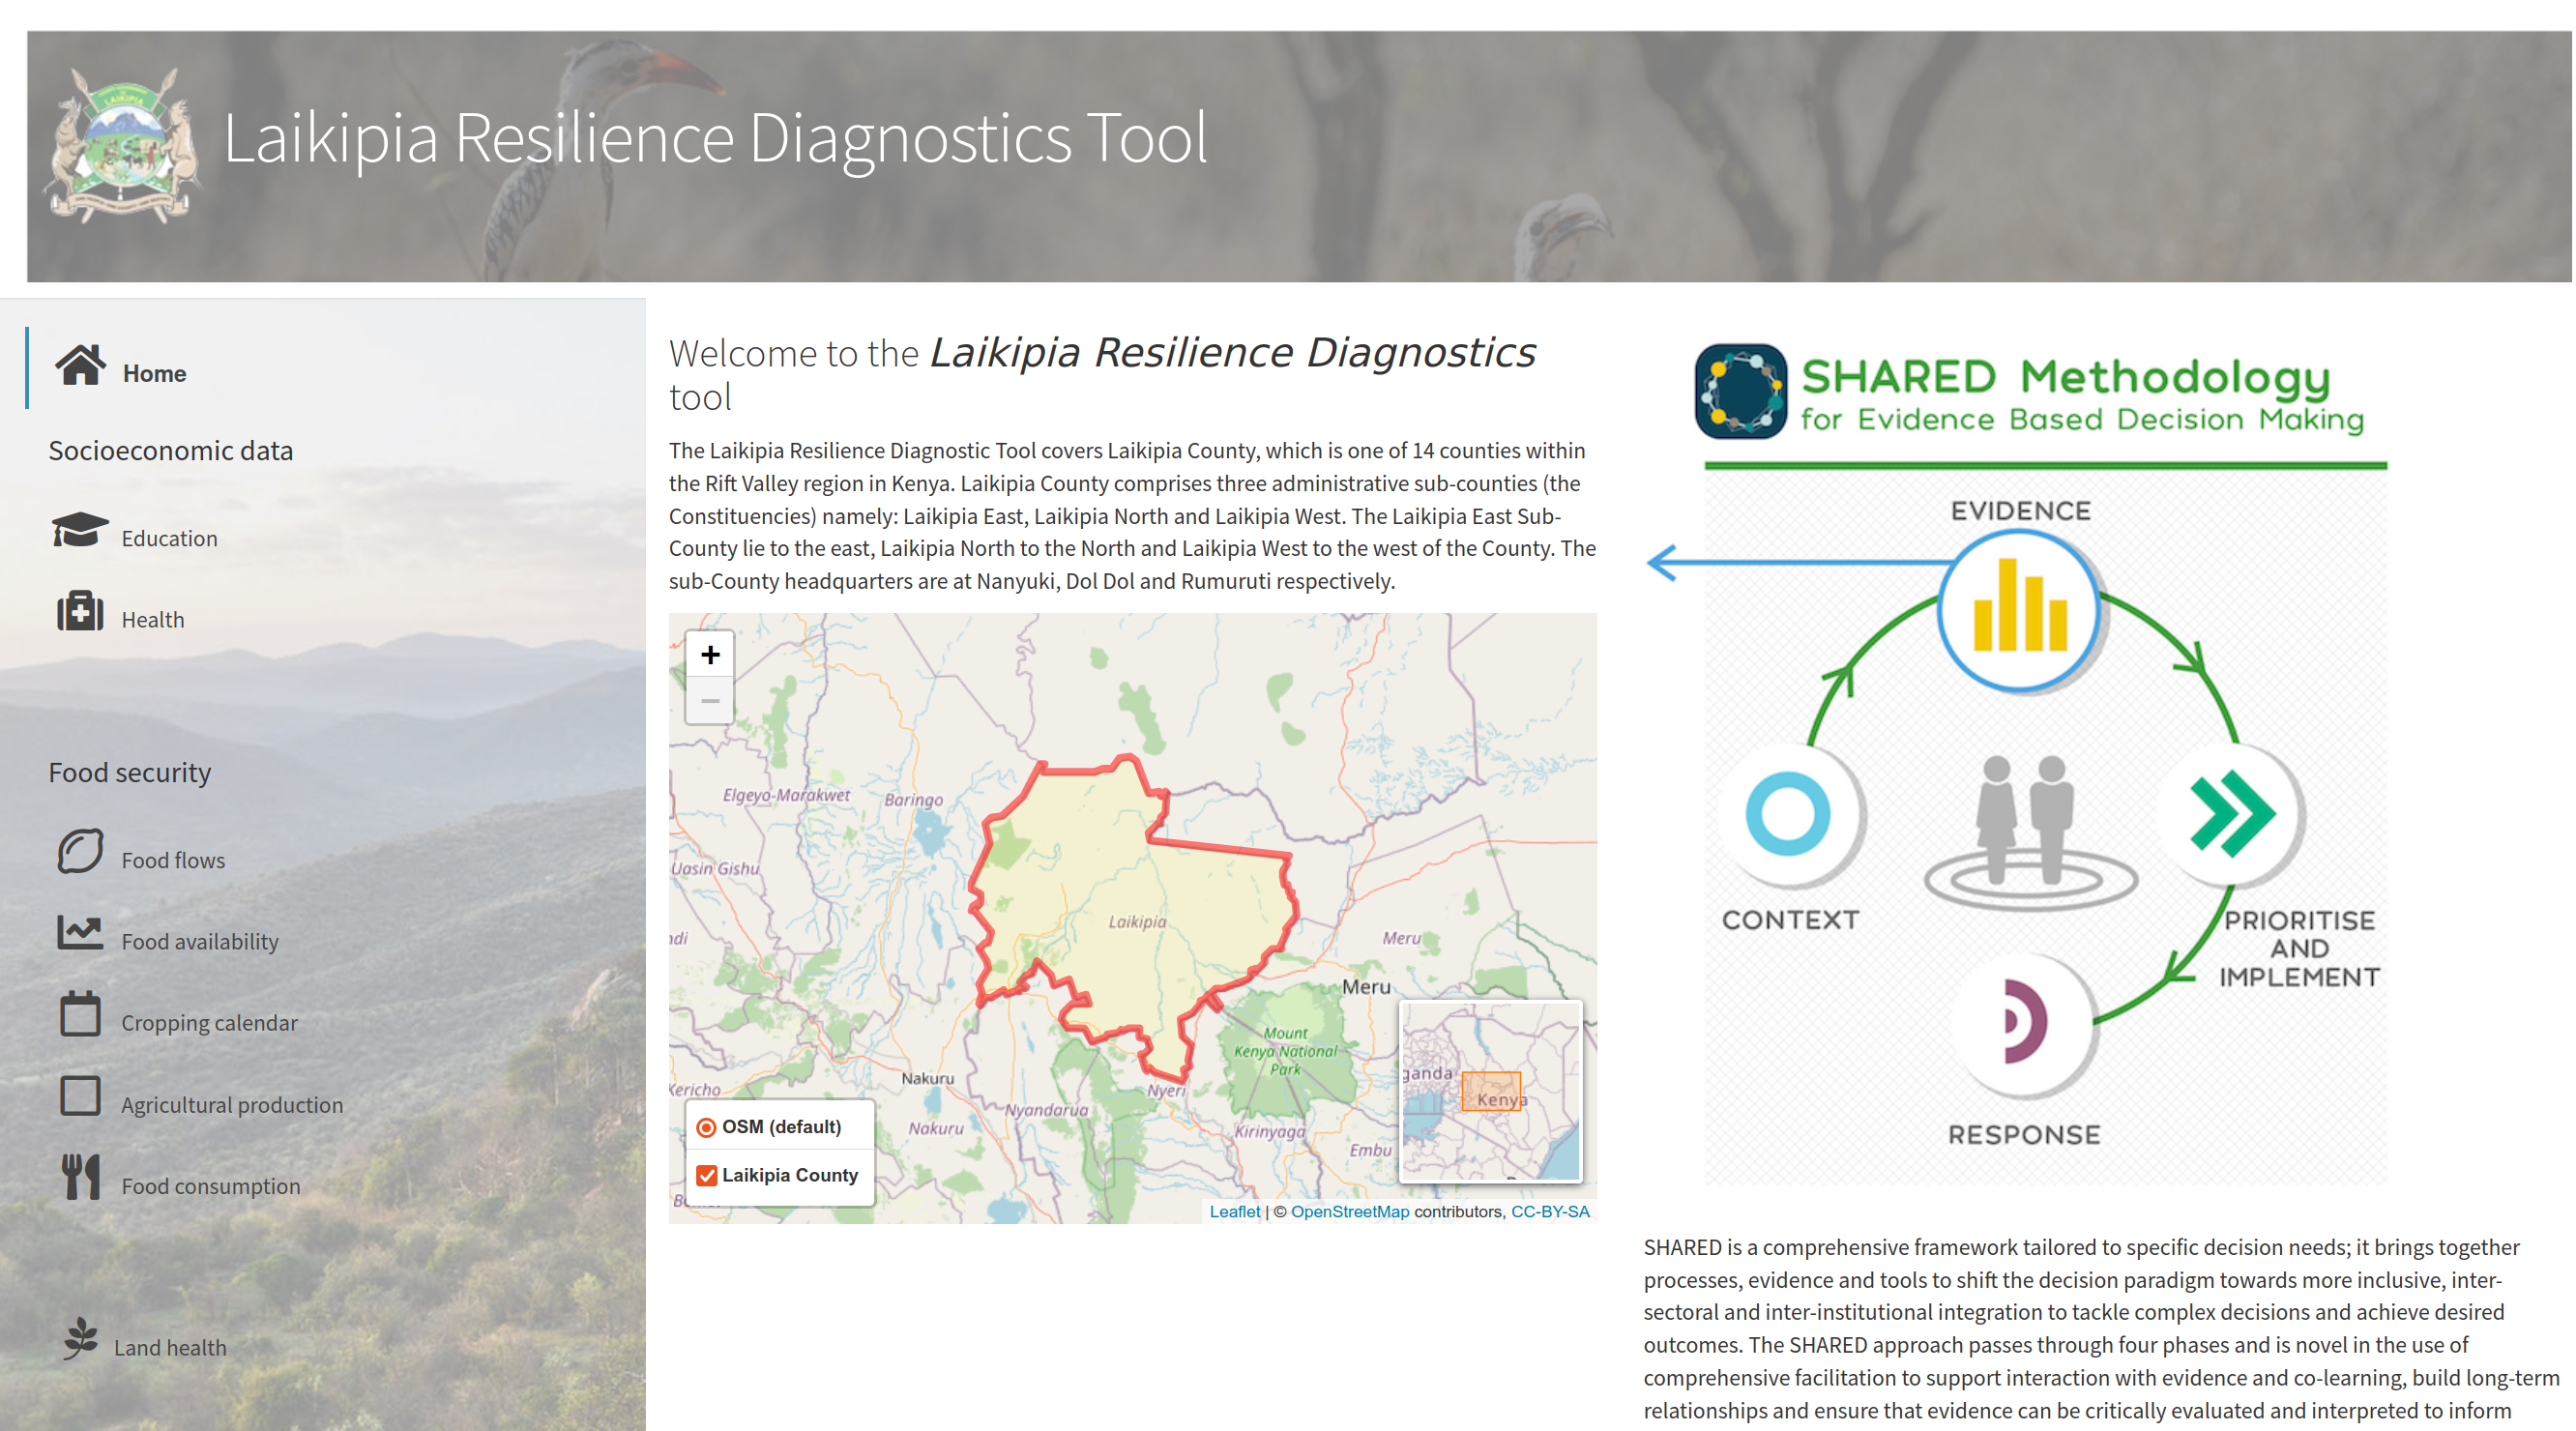
The Laikipia Resilience Diagnostic Tool covers Laikipia County, which is one of the 14 counties within the Rift valley region in Kenya. The tool provides a platform for County officials, stakeholders and investors to get insights from the data presented for purposes of decision making.
Launch dashboard
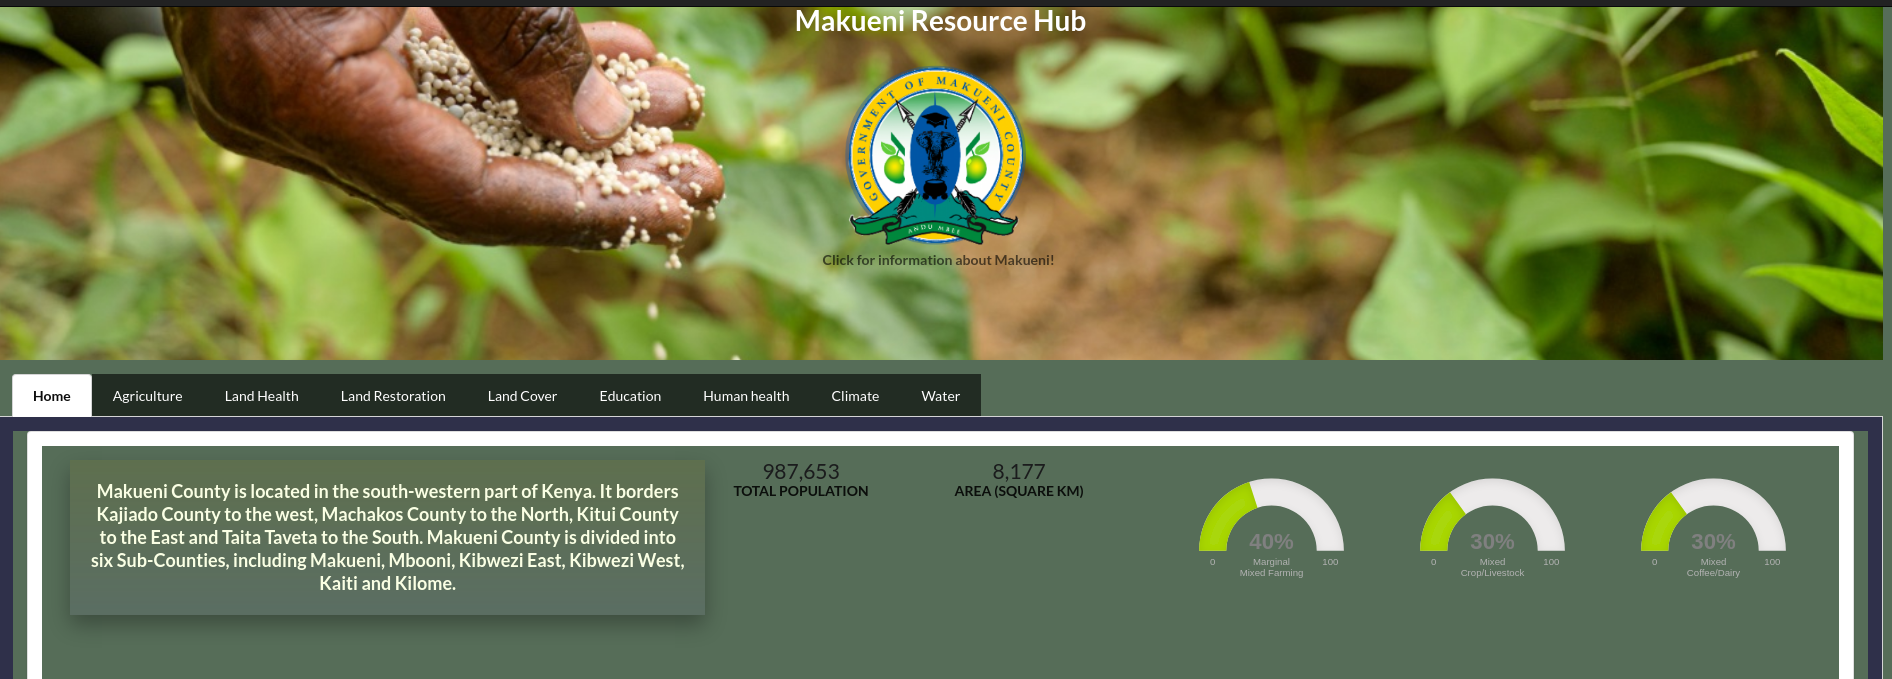
This dashboard provides a platform for sharing and interaction with critically needed data and evidence on agroforestry systems and their distribution and spatial estimates of soil and land health in Makueni county, Kenya.
Launch dashboard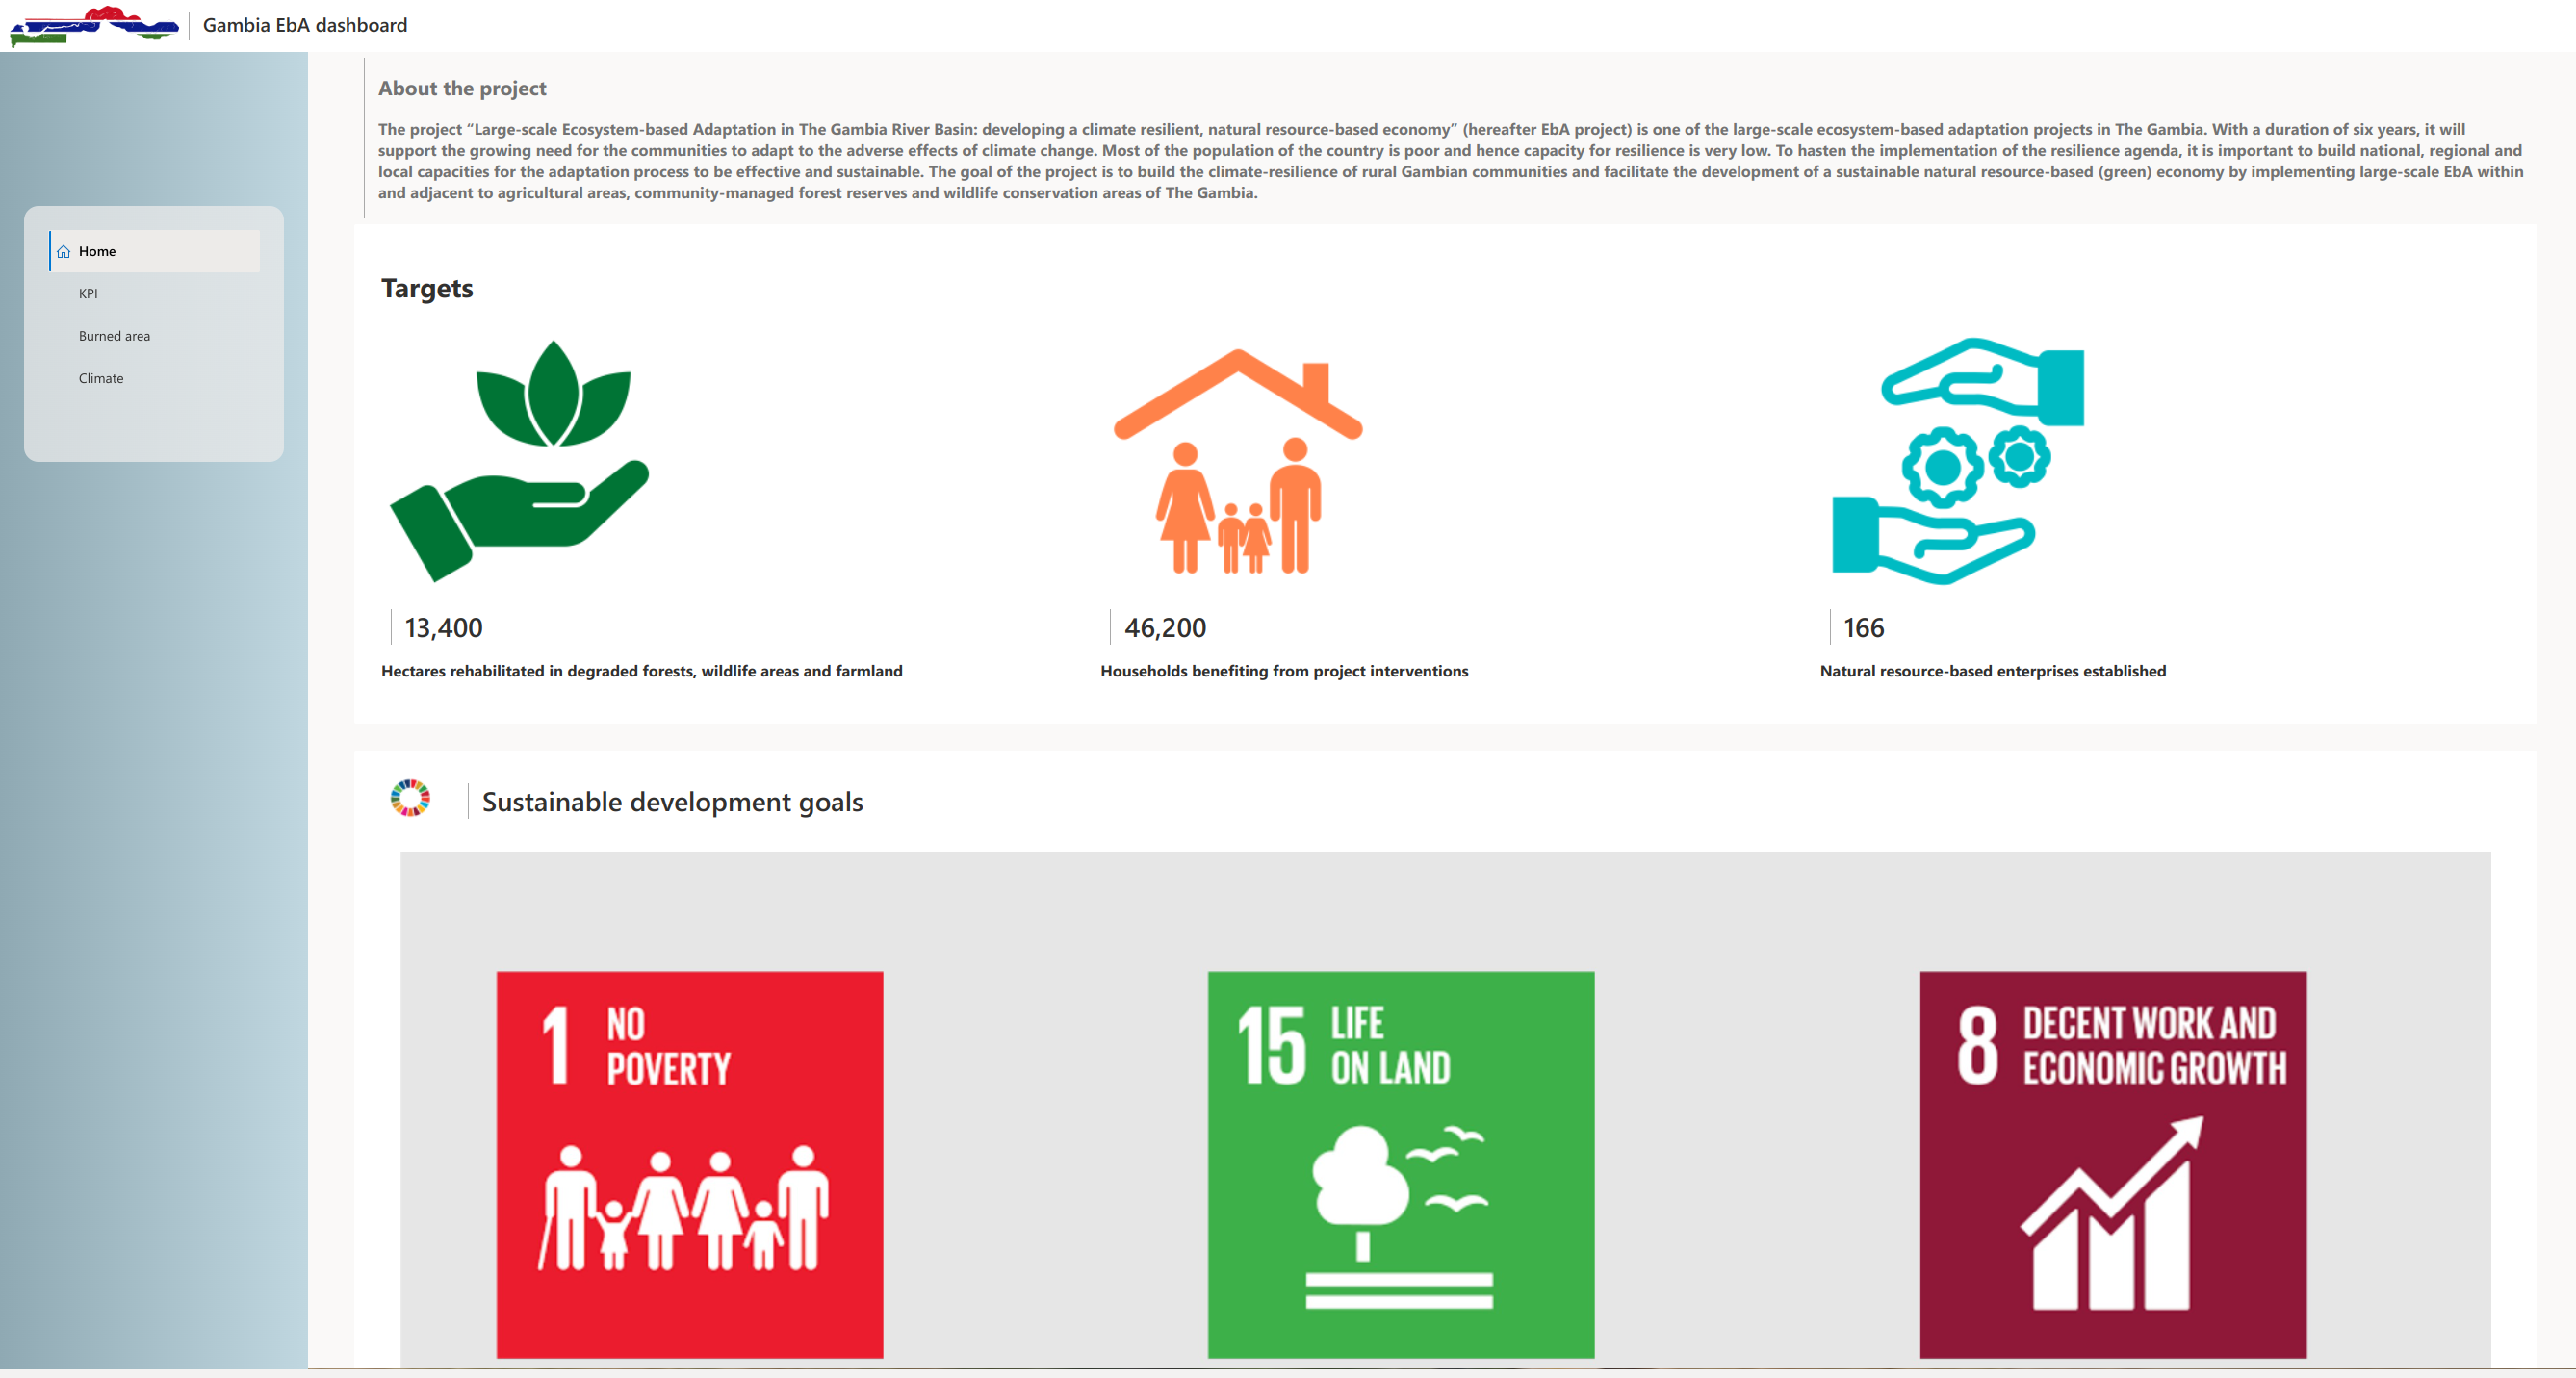
Data monitoring tool for the ecosystem based adaptation project in Gambia.
Launch dashboard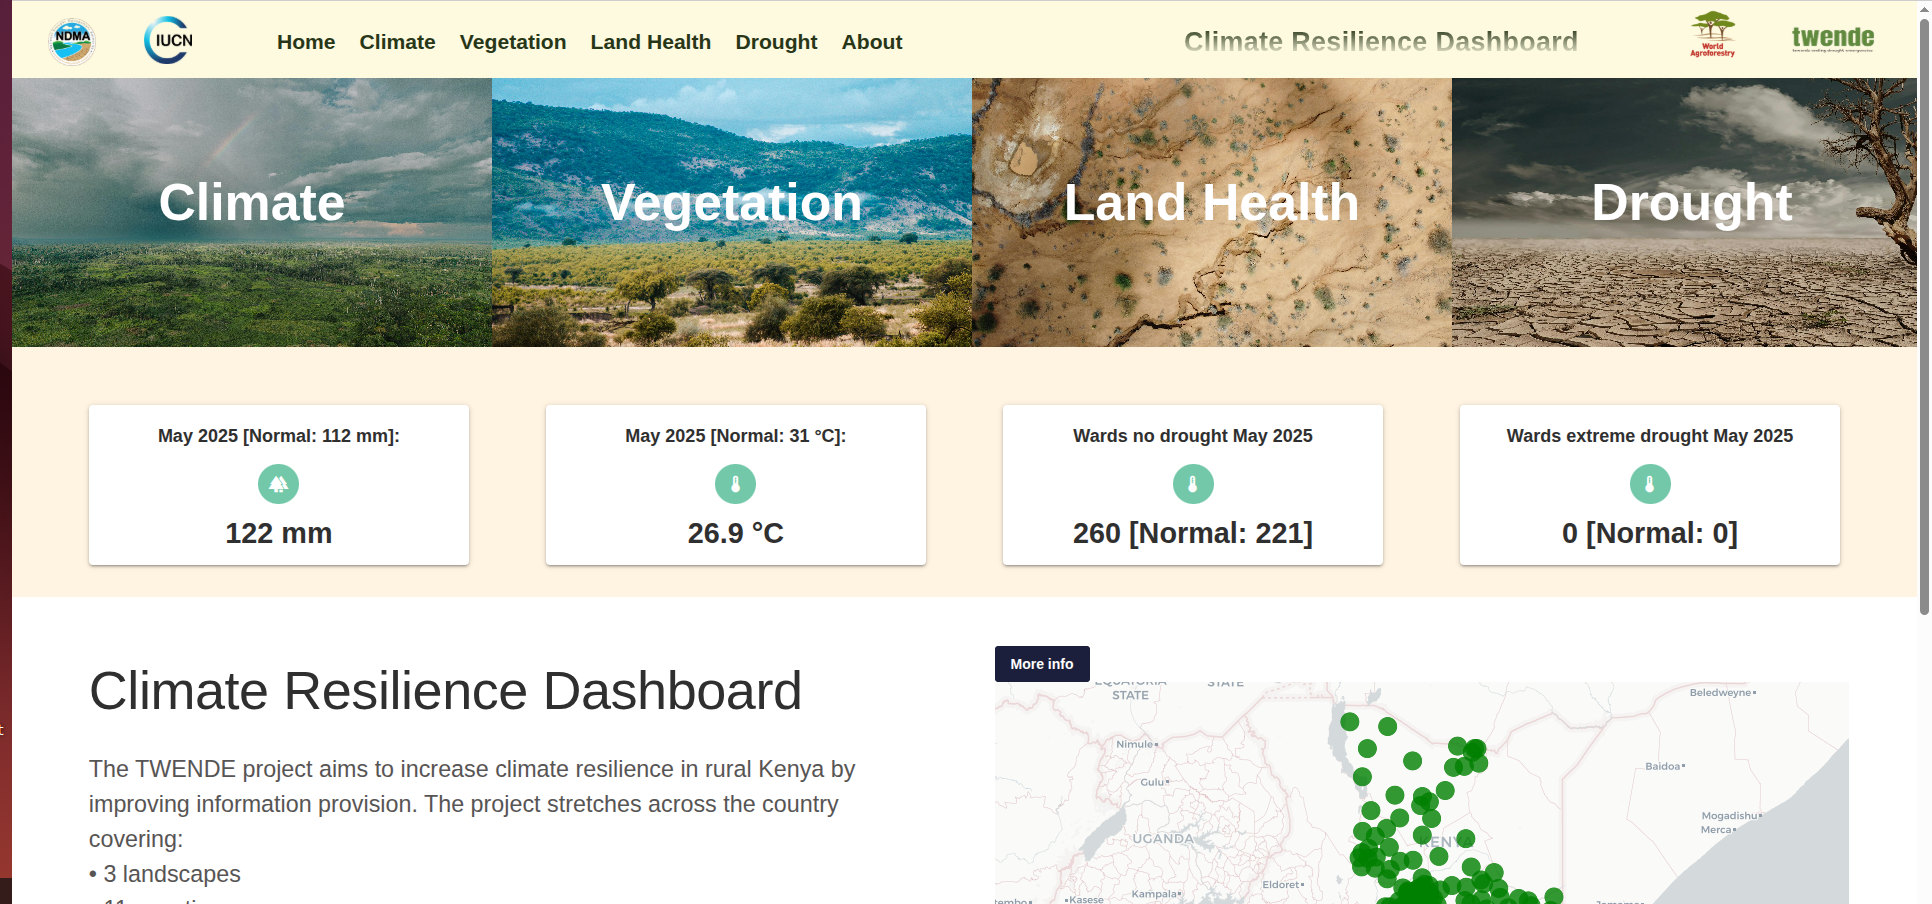
Developed together with Kenya's National Drought Management Authority (NDMA), this dashboard provides monthly-updated information on climate and drought risks.
Launch dashboard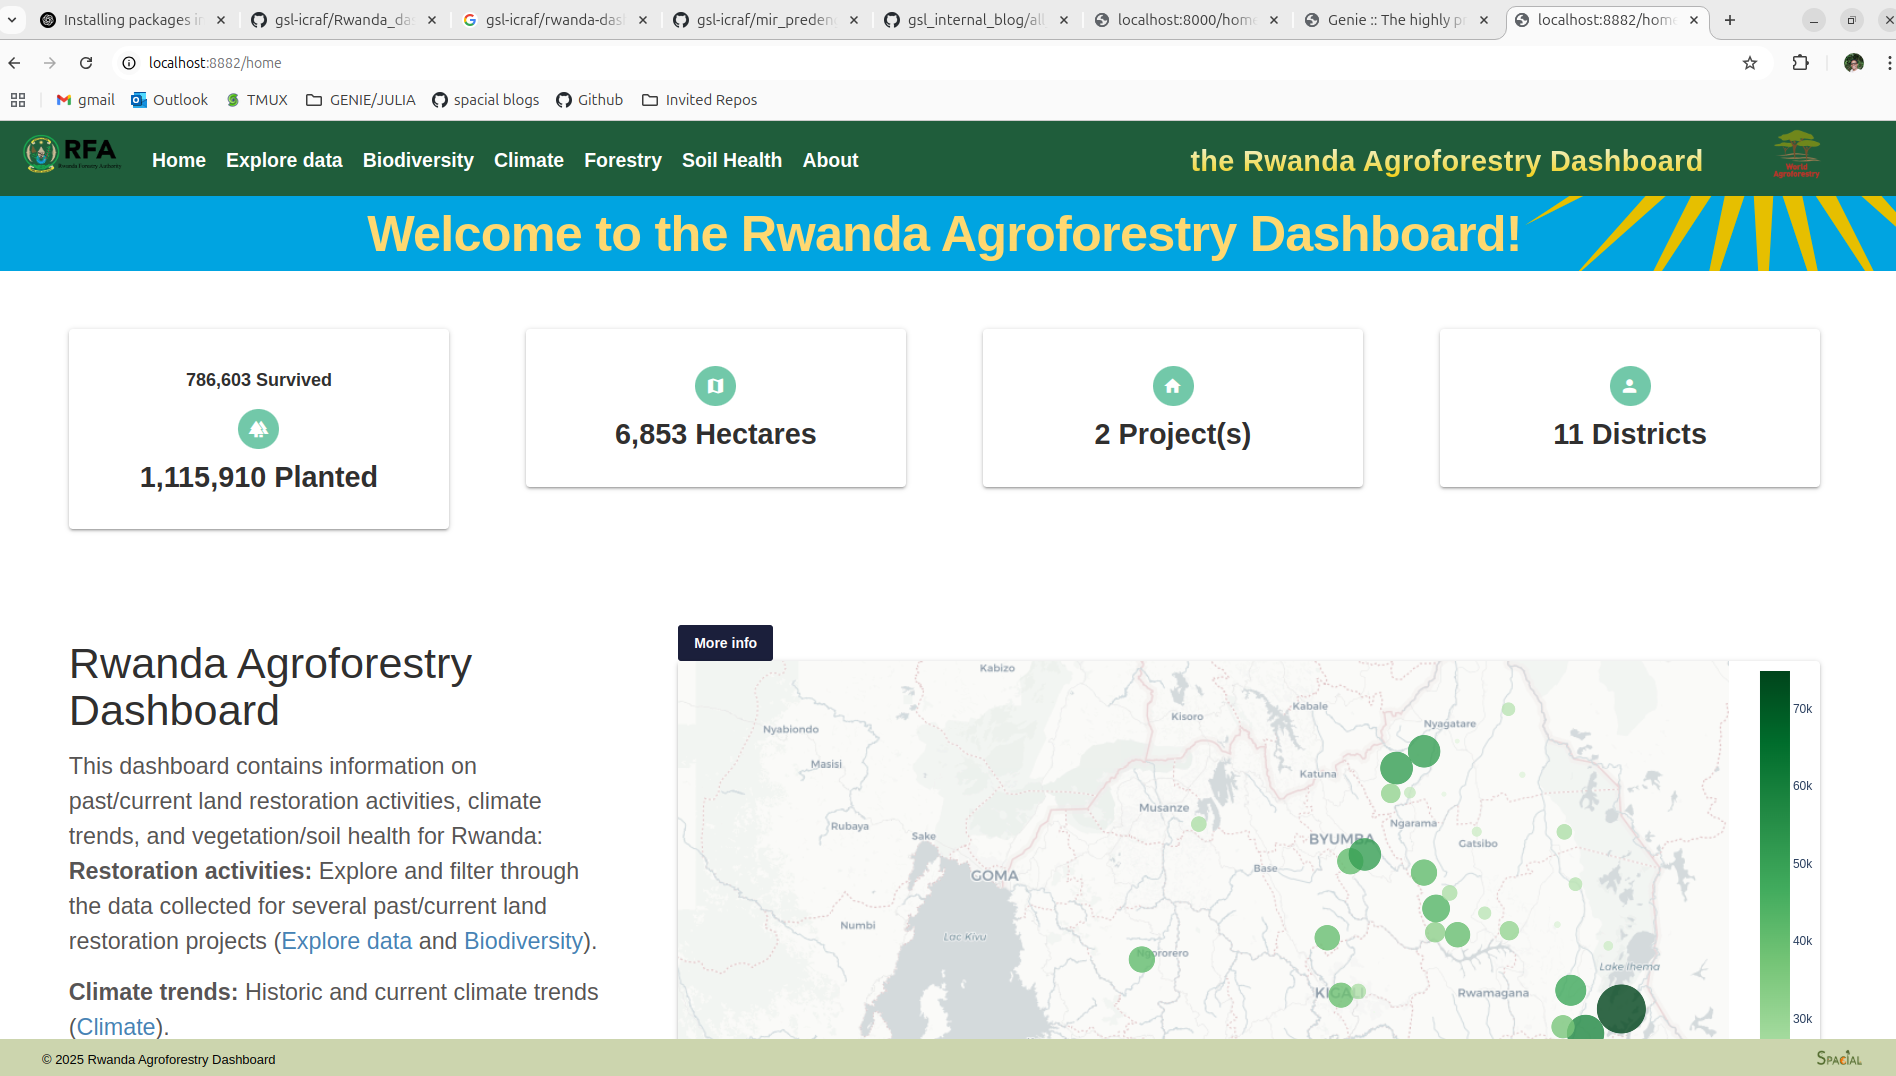
Information on past/current land restoration activities, climate trends, and vegetation/soil health for Rwanda.
Launch dashboard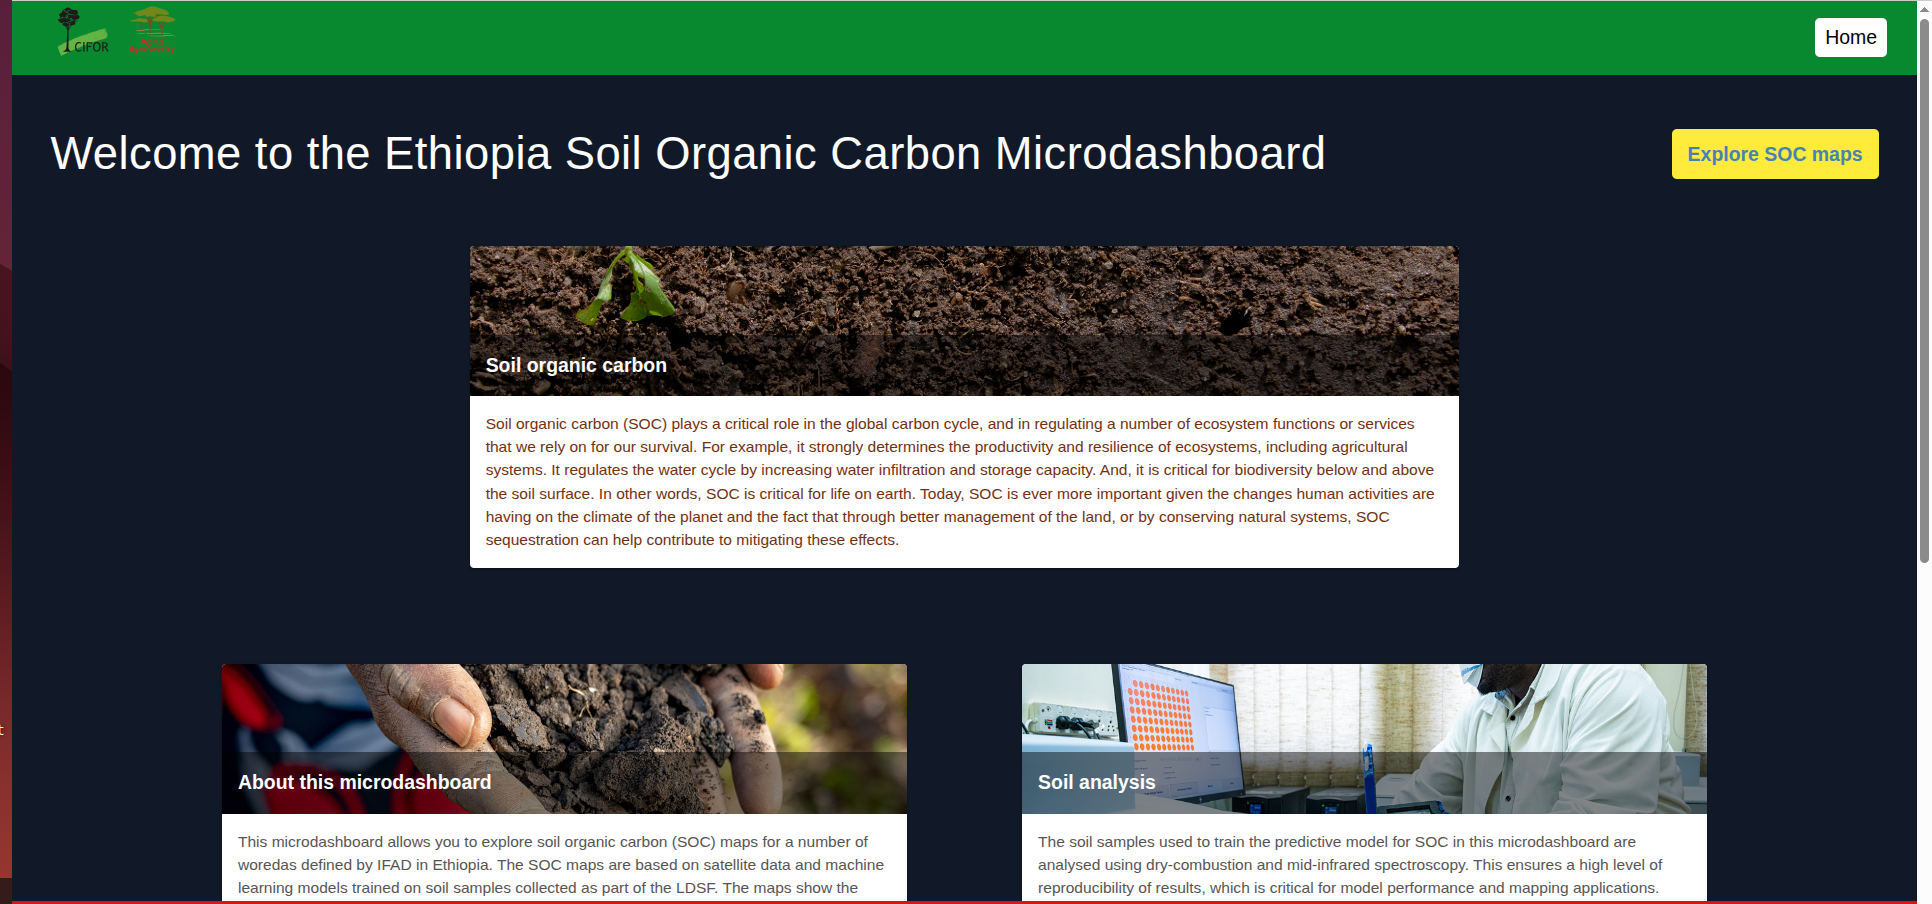
This microdashboard allows you to explore soil organic carbon (SOC) maps for a number of woredas defined by IFAD in Ethiopia.
Launch dashboard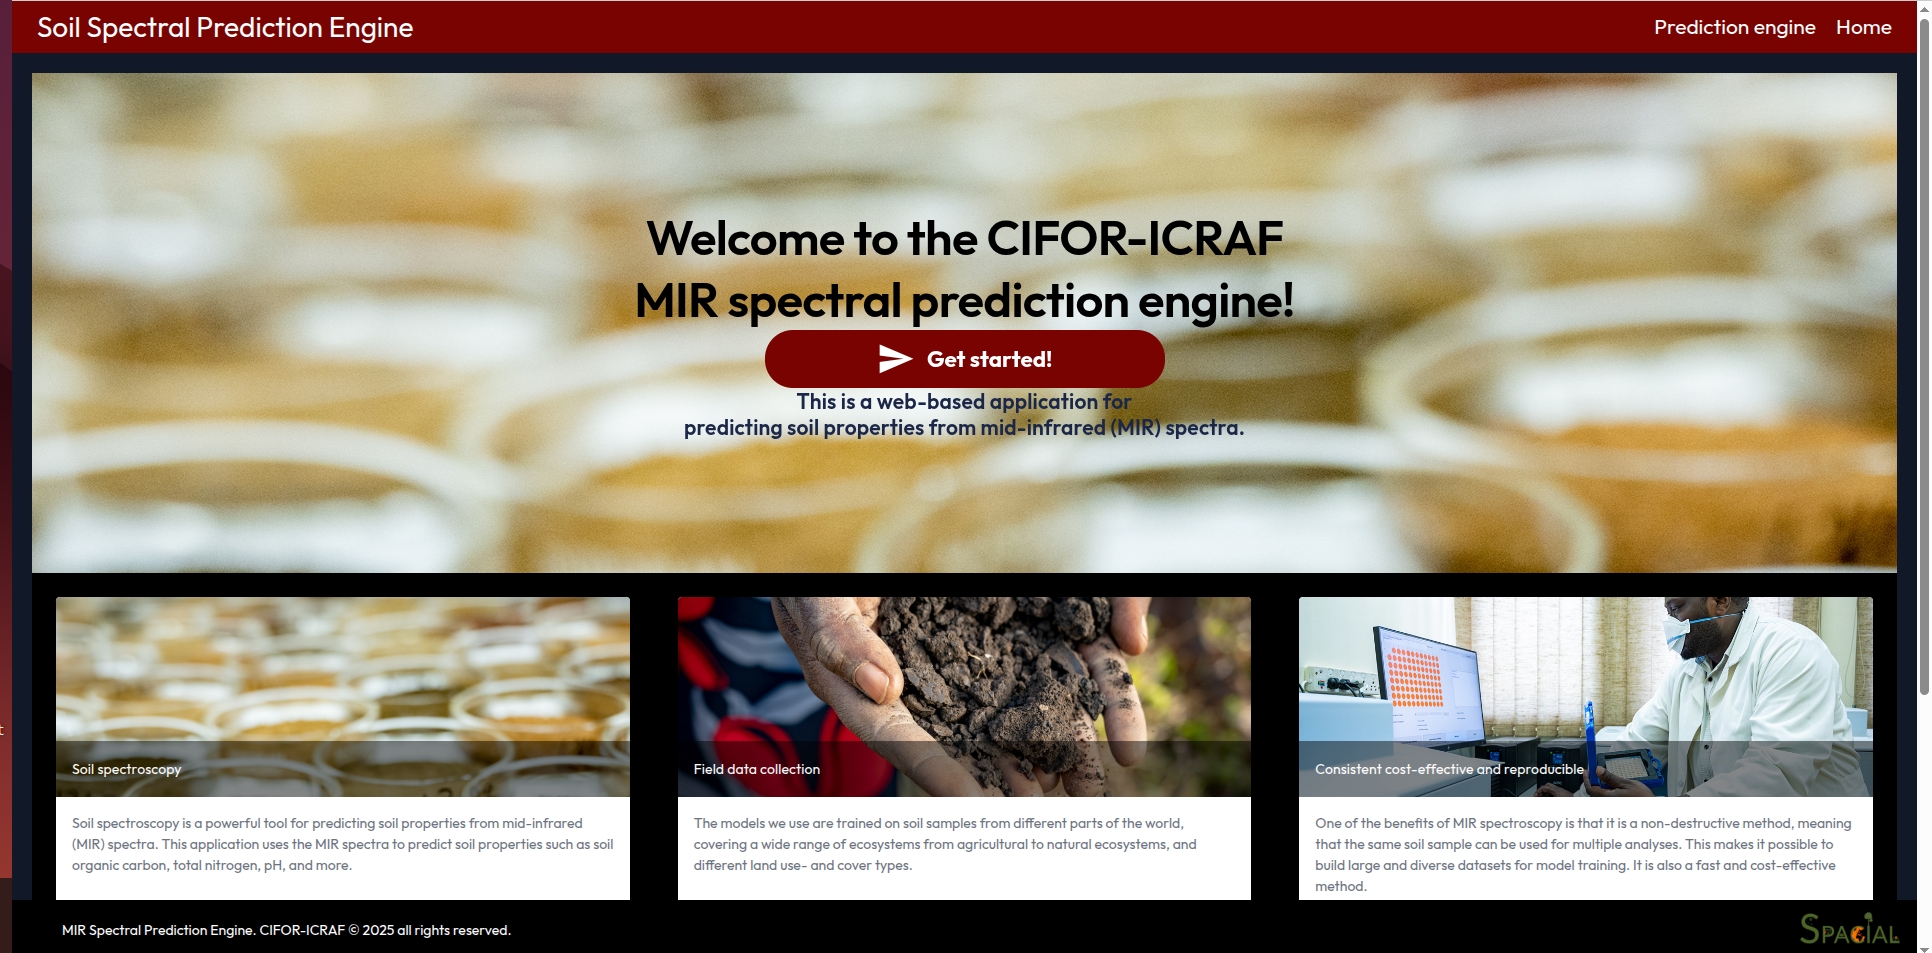
This is a web-based application for predicting soil properties (SOC, Nitrogen, pH, Sand/Clay content and more) from mid-infrared (MIR) spectra.
Launch dashboard
This dashboard shows the results of a systematic literature review on SOC pathways in African rangelands as well as the current state of SOC remote sensing based monitoring of SOC in such landscapes.
Launch dashboard